The Capital Spectator

US 10-Year Treasury Yield Continues To Trade Near “Fair Value”

In line with recent history, the benchmark 10-year yield remained close to its “fair value” estimate in January, based on the average of three models run by CapitalSpectator.com.

The near-neutral pricing, reflecting a modest premium in the market rate, has been a feature over the past five months. Previously, the 10-year yield traded significantly above fair value for several years.

The premium in the market rate was 25 basis points in January, based on analytics using monthly data. That’s up slightly from December’s premium and marks a five-month high. Despite the modest increase, the current premium remains close to fair value and extends the recent shift toward a near alignment between the market rate and the average model‑derived theoretical value.

The track record of the deviation in the market rate vs. the average fair value estimate offers an implied forecast. The quasi-random behavior of the spread, as it varies around zero through time, suggests that the relationship between the market rate and fair value isn’t persistent. In turn, that implies that when the spread is relatively wide, either negative or positive, a mean reversion is likely at some point.

Timing is always uncertain, but the spike in the previous spread well above +1 percentage point inferred that the difference would narrow, either through a decline in the market rate, a rise in the fair value estimate, or some combination of both. In Oct. 2023, when the spread had reached a multi-decade high, CapitalSpectator.com wrote: “The spread is now at the 95th percentile, based on history since 1980. That implies that we’re near the peak [for the spread].”

More than two years later, the spread has dropped sharply and returned to a near-neutral level. The adjustment has been a function of a rising fair-value estimate and a falling 10-year yield, which closed last week at 4.04% (Feb. 13), which is nearly a full percentage point below the near-5% level the benchmark rate briefly approached in market trading in Oct. 2023.


Happy President’s Day!

By excecutive order, the world headquarters of The Capital Spectator is closed today. The usual consultations reconvene tomorrow (Tuesday, Feb. 17), and without the need for congressional approval. During the interregnum, check out this week’s edition of The ETF Portfolio Strategist, our sister publication. Meantime, I hereby veto any legislation to engage in work for the remainder of the day.

Book Bits: 14 February 2026

Finding Value in Numbers: The Essential Investing Toolkit to Win on Wall Street
Ehsan Ehsani
Summary via publisher (Columbia U. Press)
To be successful as an investor, one needs a framework. And no investing framework works without numbers. Although quantitative methods can be intimidating, they provide a major boost to the quality of analysis. Written for readers without a technical background, Finding Value in Numbers is an engaging and practical guide to how thoughtful investors can use numbers—not just for the sake of crunching data but for making better decisions. Using a value investing perspective, Ehsan Ehsani shows how to deploy quantitative tools to identify and analyze investment prospects, demystifying the math that points to overlooked opportunities in the stock market, other securities, and beyond.

AI Economics: How Technology Transforms Jobs, Markets, Life, & Our Future
Benjamin Shiller
Review via Fortune
The weirdest thing of all in economics, says Brandeis University Economics Professor Benjamin Shiller, is that weirdness is closely tied to fate in the age of artificial intelligence (AI). The weirder you are, he tells Fortune, the better off you’ll be.
In his new book “AI Economics: How Technology Transforms Jobs, Markets, Life, and Our Future,” Shiller, argues that the more bizarre your job, the less likely that AI will take it. A specialist in the economics of technological change—and the son of a famous economist in his own right, Yale’s Robert Shiller, the co-creator of a national home price index still in use today, Shiller tells Fortune that the future of employment is weird.

How Africa Works
Joe Studwell
Review via The Economist
Africa is adding 300m people per decade: by 2050 it will be home to 2.5bn, a quarter of humanity. As the rest of the world ages, the continent’s youthfulness stands out. It will play a bigger role in the global labour market and as a source of consumers, culture and ideas. Thought-provoking new books about Africa are therefore sorely needed. In “How Africa Works” Joe Studwell, a visiting fellow at the Overseas Development Institute, a think-tank, has written one of the most interesting analyses of the past few years. It will prove valuable reading for anyone curious to understand “the last great frontier of global development”.

Swiftynomics: How Women Mastermind and Redefine Our Economy
Misty L. Heggeness
Review via The New Republic
Dr. Misty Heggeness, a professor at the University of Kansas and former Census Bureau economist, released an analysis last year showing that mothers with young children were leaving the workforce after pandemic-era gains. It was a wake-up call that women with young children had benefited from the remote work–friendly policies and that some of the changes made by the Trump administration, like sweeping federal layoffs, had hit women hardest.
Heggeness had used long-available data from the Current Population Survey for her analysis, but took a unique perspective to understand what was happening to women in particular. Now she’s published a book that does the same. In Swiftynomics: How Women Mastermind and Redefine Our Economy, she replaces the economics discipline’s idea of a rational “Economic Man” with a rational “Economic Woman” to show how our economy is impacted by the care that women provide, the choices they make for their families, and their perseverance despite sexism and discrimination. And yes, her muse on this journey is Taylor Swift.

Please note that the links to books above are affiliate links with Amazon.com and James Picerno (a.k.a. The Capital Spectator) earns money if you buy one of the titles listed. Also note that you will not pay extra for a book even though it generates revenue for The Capital Spectator. By purchasing books through this site, you provide support for The Capital Spectator’s free content. Thank you!

US Growth Expected To Moderate In Next Week’s Q4 GDP Report

Recession risk remains low, but the torrid pace of GDP growth in recent quarters is expected to downshift in next week’s delayed fourth-quarter report from the government, based on the median for a set of nowcasts compiled by The Capital Spectator.

Today’s update indicates a 2.7% annualized increase in GDP, unchanged from the previous estimate. If accurate, output will ease following from Q3’s 4.4% pace, a two-year high.

The upside outlier in the data sets in the chart above remains the Atlanta Fed’s GDPNow model. Note that the regional Fed bank’s nowcast has been revised lower in recent weeks and is currently estimating a 3.7% advance (as of Feb 10). That’s still a solid gain, but here too the view has cooled lately and that the economy is expected to expand at the slowest rate in the past three quarters.

Whatever next week’s numbers reveal, it’s likely that the Q4 data will confirm that the US ended 2025 with an economic tailwind. Analysis in our sister publication this week – The US Business Cycle Risk Report – highlights a persistently moderate growth pace through January, based on a broad set of business-cycle indicators.

Wednesday’s better-than-expected payrolls report for last month strengthens the view that the economy remains resilient, at least in relative terms. As a result, the recession warnings from some economists late last year still look wide of the mark.   

A low pace of layoffs via jobless claims data supports the view that the labor market is stabilizing after downshifting in last year’s second half.

There are several caveats to consider with the latest payrolls numbers, including downward revisions that show that hiring last year was substantially than previously estimated. Another issue: last month’s increase in payrolls was highly dependent on healthcare, which suggests that the cyclical parts of the economy could falter as the year rolls on.

“The surprisingly strong job gains in January were driven mainly by health care and social assistance,” says Heather Long, chief economist at Navy Federal Credit Union. “But it is enough to stabilize the job market and send the unemployment rate slightly lower. This is still a largely frozen job market, but it is stabilizing. That’s an encouraging sign to start the year, especially after the hiring recession in 2025.”

Another economist offers a similarly upbeat diagnosis: “The signal from the US labor market is that we’re nowhere near recession,” writes Robin Brooks, senior fellow at the Brookings Institution and former chief economist at Institute of International Finance. “There’s really no indication that the US economy is rolling over. If anything, the labor market says activity is picking up.”

Is Recession Risk Rising? Monitor the outlook with a subscription to:
The US Business Cycle Risk Report

New Research Highlights Value Of Forecasts From Betting Markets

Predicting is hard, especially about the future, runs an old joke. Does the “wisdom” of crowds help? There’s a long line of research suggesting it does. Combining forecasts from several models, for example, has an encouraging track record of outperforming any one model as a general rule. The latest twist on this idea arises from betting markets. As researchers study these sites and compares their forecasts with the usual suspects, the results reaffirm the value of the crowd’s view.

A pair of recent working papers dives into the details. A study published last month from the National Bureau of Economic Research finds that the forecasts from Kalshi, an online betting market, offers forecasts that are “comparable” in accuracy to “established benchmarks such as the Survey of Market Expectations and the Bloomberg consensus.” The authors add:

In several cases, they provide unique insights—particularly for variables like GDP growth, core inflation, unemployment, and payrolls, for which no other market-based distributions currently exist. We have also argued that they provide the only credible measures of distributional beliefs about decisions at specific FOMC meetings.

Another group of economists studied earnings expectations from Polymarket and report:

Our analysis demonstrates that prediction markets are efficient aggregators of information: they significantly outperform sell-side analysts in predictive accuracy and possess significant incremental explanatory power for earnings announcement returns. Furthermore, while analysts systematically underestimate earnings and exhibit underreaction, prediction market expectations are unbiased in levels and largely consistent with rational benchmarks, though we do observe short-term overreaction. Finally, we show that prediction markets lead price discovery for earnings-related information, incorporating new information before analyst forecast revisions.

“Getting information from a large pool of people can be a remarkably good form of forecasting,” said Jonathan Wright, an economics professor at Johns Hopkins University who co-wrote the NBER paper.

With that in mind, let’s check in on the latest forecasts for several upcoming macro events, starting with the next month’s policy decision at the Federal Reserve. Echoing recent history, the crowd expects the Fed to leave rates steady.

For the delayed fourth-quarter GDP report scheduled for later this month, a moderate downshift to 3.2% is expected. That’s still in line with the two previous quarterly reports in suggesting that output will continue to increase at a robust pace.

Tomorrow’s consumer inflation report for January is expected to edge higher to a ~2.8% year-over-year pace, up from 2.6% in December.

Finally, on the question of whether the US stock market (S&P 500) will post a gain for all of 2026, the current view is a moderately confident “yes”:

Learn To Use R For Portfolio Analysis
Quantitative Investment Portfolio Analytics In R:
An Introduction To R For Modeling Portfolio Risk and Return

By James Picerno

Energy Leads This Year as Tech and Financials Fall Behind

Energy, basic materials, and defensive consumer stocks are in. Tech and financials are out. That, at least, is Mr. Market’s view so far in 2026, based on a set of US equity sector ETFs through yesterday’s close (Feb. 10).

Stocks in the energy patch continue to lead the field by a solid margin. The SPDR S&P Energy ETF (XLE) is up nearly 20% year to date. In addition to leading the other equity sectors, dramatically so in several cases, these shares have also left the broad stock market in the dust in 2026’s early going, based on the SPDR S&P 500 (SPY), which is up just 1.5% this year.

Following a lackluster performance in 2025, Big Oil and other energy stocks are roaring. One theory is that the Venezuela factor lit a fire for expectations. Following the removal of the country’s leader, Nicolás Maduro, by US forces on Jan. 3, the energy sector has been on a tear.

Coincidence? Maybe, although energy bulls argue that investors anticipate that a new governing regime in Venezuela could enable US companies to resume work on rebuilding the country’s oil infrastructure, creating new business opportunities in the process.

The degree of of opportunity remains debatable, but market sentiment for now seems to be leaning into the possibilities. Skeptics note that Venezuela’s political environment is historically volatile and even under the best of circumstances it will take years for Venezuela to recover its energy-output mojo.

Another risk: Companies may hesitate until they see durable legal protections. Exxon Mobil’s CEO last month told President Trump that Venezuela is “uninvestable” and the needs to transition to democracy before energy firms can rationalize investing in the nation’s degraded oil industry.

Posting a strong second-place performance this year: stocks in the materials sector (XLB). Holding a portfolio of mining stocks and other firms that focus on basic materials and chemicals, XLB has surged nearly 17% this year, nearly doubling its performance for all of 2025.

Tied for third place for sector results this year: consumer staples (XLP) and industrials (XLI). Each fund is currently higher in 2026 by 12%-plus.

Meanwhile, the formerly high-flying tech sector (XLK) and financials (XLF) are underwater this year.

It’s still debatable if the sharp change in sector leadership is a sign of durable trend for the foreseeable future, but for now Mr. Market’s attention has shifted in a non-trivial degree.


Mixed Economic Signals Complicate Fed Rate‑Cut Path

The economy feels like a tale told through fogged‑up glass lately. Pick the “right” indicators and you can argue almost any version of reality. Forecasts are always a little blurry, but this moment feels different — the numbers themselves seem to be hiding the plot.

Let’s start with a top-down view using GDP. To judge by the popular nowcast published by the Atlanta Fed, last year ended with a strong tailwind. The regional Fed bank’s GDPNow model is estimating that the delayed fourth-quarter GDP report (due on Feb. 20) will post a robust 4.2% annualized increase. If correct, the rise will mark three straight quarters of vigorous gains.

A timelier measure of the economic trend shows that the growth bias has carried over into early 2026, based on the Dallas Fed’s Weekly Economic Index (WEI). Last week’s report indicates that four-quarter GDP growth was holding in the 2%-plus range through Jan. 31, reflecting a moderate trend that’s in line with recent history.

The labor market, by contrast, paints a weaker profile for economic activity. Several updates last week set the tone, starting with ADP’s estimate for private-sector payrolls, which posted a weak 22,000 gain in January. The estimate from Revelio Labs is even weaker, highlighting a modest loss for payrolls last month.

The optimistic spin is that the slowdown in the labor market may not be the dire signal for the business cycle that it’s been in the past. Although there’s no clear verdict yet on what the hiring slowdown really means, one theory is that the labor supply has tightened so much that the breakeven pace of job growth — the monthly gain needed to keep unemployment steady — has dropped sharply. By some estimates, that threshold slid from roughly 100,000–150,000 new jobs a month in recent years to just 30,000–60,000 by late 2025.

Investors will be watching tomorrow’s delayed payrolls update from the government for fresh clarity. The consensus forecast sees hiring at companies picking up, rising 80,000 in January, a solid improvement over December’s stall-speed gain of just 37,000, according to Econoday.com.

Enter the Federal Reserve, which is tasked with deciding if the economy’s slowing to the point that more rate cuts are needed. For now, the outlook is sufficiently cloudy to persuade the market that the Fed will leave rates unchanged at the next two policy meetings in March and April. By June, policy easing will resume, according to Fed funds futures.

The policy-sensitive US 2-year Treasury yield is also watching and waiting, as it trades close to the median Effective Fed Funds rate.

The question is what will move the needle for Fed policy decisions? Weaker-than-expected data for payrolls tops the list, and so Friday’s report could be decisive. After months of a hiring slowdown, clearer signs that the labor market is still cooling could trigger more rate cuts sooner than expected.

Just to keep things interesting, Friday’s report will also reflect routine revisions to the government’s 2025 data. Analysts say the revisions will show the economy minted fewer jobs than previously reported. Not exactly the vibe that the bulls are looking for.

“If you’re not looking so much at GDP and the stock market right now and you’re focusing just on the labor market, it definitely seems like the momentum is skewed toward more risks of a downturn at the moment,” says Cory Stahle, an economist at the Indeed Hiring Lab.

Is Recession Risk Rising? Monitor the outlook with a subscription to:
The US Business Cycle Risk Report

A New Oil Era—or Just Noise? The Venzuela Factor Lifts Big Oil

The fortunes of companies in the alternative energy sector crushed Big Oil shares last year. The leadership shift in favor of various slices of so-called clean energy shares surprised some market observers. The Trump administration, after all, hasn’t been shy about favoring the fossil fuels industry and changing the regulatory landscape toward that end. But in recent days Big Oil has found a second wind after lagging in 2025. Investors are now wondering: Was last year’s rebound in alt energy a one-off?

It’s still early in the year and so the rebound in Big Oil lately could be noise. Nonetheless, the surge in the likes of Exxon Mobil and Chevron this year are striking after a lackluster run in 2025.

An ETF proxy (XLE) for Big Oil is up 19.1% so far this year (through Feb. 6), or more than double the fund’s modest 7.9% increase for all of 2025. By comparison, the iShares Global Clean Energy ETF (ICLN) is up 13.2% year to date, which follows the fund’s sizzling 47.0% surge in 2025.

What’s changed to turn the tables on the clean energy recovery? In a word, Venezuela. After the US captured the country’s leader, Nicolás Maduro, last month and President Trump outlined plans to control Venezuela’s oil industry, the headlines have persuaded investors that a new era may be dawning for fossil fuel companies in the Western Hemisphere.

Although there are many risks ahead, Venezuela’s potential as an energy source is impressive, if only on paper so far. The country holds the world’s largest proven oil reserves, albeit in heavy crude deposits, which require costly processing compared with, say, Saudi Arabia’s light, sweet crude.

The bigger challenge: the long-running decay in Venezuela’s oil-industry infrastructure will take years to repair at a cost of many billions of dollars. ExxonMobil CEO Darren Woods told President Trump last month that Venezuela is “uninvestable.”

At the moment, Chevron is the last US oil firm still operating in Venezuela, but the Trump administration is working to smooth the path to incentivize more US oil companies to invest in the country. “The President’s team is working around the clock to ensure oil companies are able to make investments in Venezuela’s oil infrastructure. Stay tuned,” White House spokeswoman Taylor Rogers said in a statement last week.

How much of an opportunity Venezuela represents to Big Oil is still an open question. There are still many unanswered questions for a recovery that, even under the best of scenarios, will take years, given the deterioration that’s unfolded in the country oil infrastructure.

There’s also a tangle of unresolved legal issues. As Energy Intelligence Group, a consultancy, observes:

For international oil companies, service providers and financiers, a key question is whether Venezuela’s unresolved liabilities can be reconciled in a way that doesn’t dissuade potential new investment in a country that boasts the world’s largest oil reserves but requires massive outlays to revive its moribund energy infrastructure.

Considering the big picture, there’s still plenty room for debate about whether the Venezuela factor has materially altered Big Oil’s fortunes from an investment perspective. The 2025 leadership shift in favor of alternative energy companies has taken a hit so this year, but that could be noise. For a clearer view of the trend, it’s helpful to monitor how XLE, the Big Oil ETF proxy, fares against its clean-energy counterpart (ICLN).


As the chart above highlights, Big Oil’s strong run so far this year has yet to make a convincing dent in the trend bias that switched in 2025 in favoring clean energy shares.

Is the Venezuela factor a temporary bump that will fade as the messy details of rebuilding the country’s oil business become clearer? The alternate view is that Big Oil is on the cusp of a new era of opportunity. Maybe, but for the moment the trend chart above suggests the market has yet to reverse its clean-energy bet.

Learn To Use R For Portfolio Analysis
Quantitative Investment Portfolio Analytics In R:
An Introduction To R For Modeling Portfolio Risk and Return

By James Picerno

Book Bits: 7 January 2026

The Doom Loop: Why the World Economic Order Is Spiraling into Disorder
Eswar Prasad
Review via The Economist
His book contends that changes to the balance of power between countries—the rise of China and India, the waning dominance of the West—have transformed the world economy into an engine for disorder. Once, this reconfiguration might have offered “opportunities for greater stability”, with countries choosing to “deploy their power in constructive ways for fear of losing influence”. But instead “the feedback loop between economics, domestic politics and geopolitics is spiralling out of control and becoming destructive on every front.”

Skill Versus Luck: Taking the Guessing Out of Equity Fund Selection
Michael A. Ervolini
Summary via publisher (MIT Press)
Skill is the raison d’être for active equity management. Yet precious little is known about manager skill. What is skill? Who has it? How should it be measured? Is a manager’s skill improving, declining, or remaining consistent? Without answers to such fundamental questions, capital allocators have no choice but to rely on inferences, hunches, and guesswork. In Skill Versus Luck, Michael Ervolini explains how to move beyond skill fog with newer analytics developed over the past decade. Unlike conventional analytics that simply rehash fund outcomes, the newer cause-and-effect analytics relate a manager’s decisions to fund excess returns, providing rigorous measures of manager skill. Results from these newer analytics enable capital allocators to understand manager skill for the first time and make more effective allocation decisions.

The Banker Who Made America: Thomas Willing and the Rise of the American Financial Aristocracy, 1731-1821
Richard Vague
Summary via publisher (Polity)
If you haven’t followed the money, chances are you don’t know the real story of America and its Revolution. Nothing gives a clearer insight into this history than the life of early America’s dominant merchant trader, first bank president, and first central banker, Thomas Willing. Richard Vague shows how Willing bankrolled – and in the process helped save – the Revolution and then fundamentally shaped the financial architecture of the young Republic. So powerful was Willing that President John Adams complained that George Washington and Alexander Hamilton were governed by him. Yet at a decisive moment in Willing’s life he voted against independence, as conflict between Pennsylvania’s moneyed elite and the emergent lower and middle classes embroiled the politics of 1776 in bitter class conflict. This dynamic would continue after independence, as Willing and his associates attempted to tame the democratic forces unleashed by revolution and thereby set up a tension that has never stopped shaping US politics.

Please note that the links to books above are affiliate links with Amazon.com and James Picerno (a.k.a. The Capital Spectator) earns money if you buy one of the titles listed. Also note that you will not pay extra for a book even though it generates revenue for The Capital Spectator. By purchasing books through this site, you provide support for The Capital Spectator’s free content. Thank you!

Is Bitcoin Digital Gold or Fool’s Gold? The Market’s Still Deciding

Bitcoin is back in the headlines after the world’s largest cryptocurrency tumbled sharply on Thursday, briefly slipping below $61,000. The drop marks a decline of more than 50% from its October peak, when it surged past $126,000 to a record high.

As of this writing, bitcoin has clawed back some of those losses and is trading near $66,000. But whatever its supporters or critics expect from the asset, one thing remains constant: extreme volatility is a feature that will likely endure.

That volatility underscores bitcoin’s biggest challenge relative to the use case laid out in the 2008 whitepaper by its still-unknown creator, Satoshi Nakamoto. The original vision imagined bitcoin as a peer‑to‑peer electronic cash system—an alternative monetary frontier enabling direct payments without banks, governments, or other intermediaries. Decentralized transactions, in theory, would free individuals from the traditional financial system.

But the monetary revolution didn’t unfold as planned. Over time, the idea of bitcoin as a medium of exchange has faded, largely because of the practical hurdles of using it for everyday purchases.

Instead, bitcoin’s appeal has shifted toward its supposed role as a store of value. Rather than buying groceries or making a down payment on a house or car, advocates now argue that holding bitcoin is prudent because it will preserve purchasing power over the long run. In this narrative, bitcoin becomes a hedge against inflation, geopolitical turmoil, and broader macroeconomic instability.

The comparison to digital gold rests on bitcoin’s limited supply: only a finite number can ever be mined. Scarcity is indeed a prerequisite for any store‑of‑value asset. But scarcity alone doesn’t guarantee that bitcoin will behave like gold in the long run. Much depends on how market sentiment evolves—and crypto crashes don’t help the case.

Whether bitcoin ultimately earns that store‑of‑value status is unknowable. Still, a growing number of investors, institutions, and even governments have added it to their balance sheets.

The problem is that it’s difficult to view bitcoin as a reliable store of value when its price can swing so violently in short periods. Gold has its own volatility, but it benefits from centuries of history as a monetary asset. Its long‑term record of preserving value relative to paper currencies is well‑documented. Projecting that legacy onto an asset not yet two decades old is still a leap.

As a speculative asset, however, bitcoin excels. The question is whether speculation alone can sustain it?

A popular 2023 book captured the quasi‑religious fervor that often surrounds bitcoin. “For Bitcoin believers, the rising price became its own justification,” observes Zeke Faux in Number Go Up: Inside Crypto’s Wild Ride and Staggering Fall. At a Miami conference, speakers leaned on circular logic: bitcoin will rise because it has risen. The mantra—“number go up”—became both rallying cry and worldview.

Bitcoin may one day become a respected store of value and/or a widely used medium of exchange. It may also end up as a historical footnote—a bold but failed experiment in digital finance. Even if you believe some version of the crypto future is inevitable, bitcoin faces no shortage of rivals vying for the same crown. The road ahead remains uncertain and treacherous for Nakamoto’s creation.

For now, the only certainty is that the volatility isn’t going anywhere.

Moderate Growth Still Expected For Delayed US Q4 GDP Report

Barring another glitch in the federal government’s on-again-off-again operating schedule, the delayed report for the fourth-quarter GDP report is set for release in two weeks (Feb. 20). When the update arrives, it’s on track to report a softer-but-still-resilient expansion for last year’s final quarter, based on the median for a set of nowcasts compiled by The Capital Spectator.

Today’s update indicates 2.7% annualized growth for Q4. That’s substantially below Q3’s torrid 4.4% pace. Despite the anticipated downshift, the Q4 nowcast, if correct, will reaffirm US economic resilience prevailed through the end of 2025.

Economic data from other sources unaffected by the government shutdown already highlight a strong probability that the economic expansion continued through December into January. The Dallas Fed’s Weekly Economic Index (WEI), for instance, reflects a steady, moderate year-over-year trend in GDP in recent history.     

PMI survey data for December and January also suggest that a growth bias endures. “Sustained service sector growth, supported by a robust rise in manufacturing output in January, indicates the economy is growing at an annualized rate of around 1.7%,” says Chris Williamson, Chief Business Economist at S&P Global Market Intelligence.

The recession worries of several months back in some circles once again look misplaced. That doesn’t mean that the economy doesn’t face challenges. But US resilience isn’t easily displaced, which is surprising, given the turmoil over the past year on trade, monetary policy, and elsewhere.

“Textbooks would say uncertainty is bad for economic growth, but there’s not much evidence that it’s had a significant impact on the US economy so far,” said Neil Shearing, group chief economist at Capital Economics. “Business investment is the first place you would expect it to show up, but that’s been strong.”

Is Recession Risk Rising? Monitor the outlook with a subscription to:
The US Business Cycle Risk Report

Exactly why the US growth has held up better than expected will take time to unravel. Meantime, it’s fair to say that 2025 looks set to go into the history books as a year that defied the experts in terms of growth’s persistence.

“If you walked 100 economists in a room one year ago and informed them of these developments today, I suspect virtuallyall would project the US economy would be stagnant at best and cratering at worst,” said Ben Harris, director of economic studies at the Brookings Institution, during a conference last week at the think tank.

He continued: “Why haven’t simultaneous shocks, previously thought to be catastrophic, derailed the economy? I see four possible explanations. The shocks are not as large as some may think, offsetting stimuli compensate for the negative impact, prior understanding the economy is misguided, it will take time to realize the full impact of recent policy decisions. Ultimately, my conclusion is more pessimistic than I would hope for. If these policy shocks persist, their impact will likely be more damaging than what we have observed so far.”

Small Cap Stocks Continue To Roar In 2026

Three weeks ago I wondered if the leadership rotation this year toward small- and micro-cap stocks would persist. There have been multiple false dawns in recent years as large caps and growth stocks regained the performance crown after a burst of small-cap strength. The case for arguing this time is different is still shaky, but small-cap strength persists, based on a set of equity risk factor ETFs through yesterday’s close (Feb. 3).

Leading the charge higher this year: micro caps (IWC), which is still running hot in 2026 and posting an 8.7% year-to-date gain. In close pursuit: small-cap value (IJR) and small-cap core (IJR). Large-cap value (IVE) and large-cap (IVW), by contrast, are trailing by wide margins, as is the equity market benchmark via SPDR S&P 500 ETF (SPY). To top off the point, note that large-cap growth is slightly in the red so far this year via an 0.8% loss.

We’ve been here before and so a healthy dose of skepticism is still in order before assuming that this year’s leadership shift is the new world order for the stock market will prevail in the months (and years?) ahead. As reported on these pages many times in recent years, early signs of a small-cap resurgence have come to naught. In Oct. 2024, for example, some analysts predicted that a turning point in favor of small caps had arrived, which prompted our question: Are Reports Of Small-Cap Stocks’ Revival Prospects Premature?

The answer was forthcoming: small caps continued to struggl, again, to keep pace, much less outperform, large caps.

As this year kicks in, the question of staying power is again topical, and once again there are analysts giving encouraging odds that the small-cap rally will persist and thrive. A familiar refrain: valuations for smaller companies look enticing when compared to lofty heights for large caps, led by the tech darlings.

“According to our valuations, we think they have further to run,” reasoned Morningstar Chief US Market Strategist Dave Sekera last week.

Looking forward, our economics team forecasts at least two more cuts to the fed-funds rate this year and long-term interest rates to fall further. Plus, the AI buildout boom has spurred faster-than-expected economic growth. Historically, small-cap stocks perform best when the Fed is easing monetary policy, long-term interest rates are declining, and the rate of economic growth is reaccelerating.

Eric Diton, president and managing director of The Wealth Alliance, is also on the bandwagon and forecasts earnings momentum will keep the small-cap train running. “Small stocks have been crushed by large stocks’ outperformance in the last 15 years,” he notes in an interview with Reuters a few days ago. But the tide is turning, he says. The engine for the shift: “We’re expecting some big small-cap earnings this year and next. We’re overdue for some big small-cap outperformance.”   

Using the iShares Small Cap Core ETF (IJR) as a benchmark suggests the tailwind of optimism continues to blow strong from the perspective of the trend bias.

If IJR can muster another leg up and take out its previous high at just over 130, the case for expecting it’s different this time will strengthen. That alone won’t ensure an extended run of outperformance, but it’s a start. Rebuilding confidence and laying the foundation for a durable run of small-cap leadership will take time, but repair and recovery efforts are off to an encouraging run in the early weeks of 2026.


Total Return Forecasts: Major Asset Classes | 3 February 2026

The long-term return forecast for the Global Market Index (GMI) held steady in January at 7%-plus while the benchmark’s trailing 10-year shot higher through last month, rising above 10%. The near-three-percentage-point spread between the high-flying trailing results and the relatively moderate outlook is unusually wide. The gap suggests that investors should manage expectations down for the performance outlook for globally diversified portfolios in the years ahead.

GMI is a market-value weighted mix of the major asset classes (excluding cash) via ETF proxies. Today’s forecast is calculated as the average of three models (defined below). The current 7.3% annualized estimate for GMI is unchanged from the January estimate, but remains well below the trailing 10.1% annualized return that GMI has generated over the past decade.

In the wake of strong gains in several markets and asset classes recently, nearly half of GMI’s components are projected to generate returns that are below results for the past ten years. Ditto for GMI, which is currently projected to earn a substantially softer return compared with its performance over the trailing ten-year window through January.


GMI represents a theoretical benchmark for the “optimal” portfolio that’s suited for the average investor with an infinite time horizon. Accordingly, GMI is useful as a starting point for customizing asset allocation and portfolio design to match a particular investor’s expectations, objectives, risk tolerance, etc. GMI’s history suggests that this passive benchmark’s performance will be competitive with most active asset-allocation strategies, especially after adjusting for risk, trading costs and taxes.

It’s likely that some, most or possibly all of the forecasts above will be wide of the mark in some degree. GMI’s projections, however, are expected to be somewhat more reliable vs. the estimates for its  components. Predictions for the specific markets (US stocks, commodities, etc.) are subject to greater volatility and tracking error compared with aggregating the forecasts into the GMI estimate, a process that may reduce some of the errors through time.

Another way to view the projections above is to use the estimates as a baseline for refining expectations. For instance, the point forecasts above can be adjusted with additional modeling that accounts for other factors and models not used here. Customizing portfolios for a specfic investor, to reflect risk tolerance, time horizon, and so on, is also recommended.

For perspective on how GMI’s realized total return has evolved through time, consider the benchmark’s track record on a rolling 10-year annualized basis. The chart below compares GMI’s performance vs. ETFs tracking US stocks and US bonds through last month. GMI’s current return for the past ten years is a sizzling 10.1%, a roaring performance that marks the strongest pace by far for the historical record shown.

Here’s a brief summary of how the forecasts are generated and definitions of the other metrics in the table above:

BB: The Building Block model uses historical returns as a proxy for estimating the future. The sample period used starts in January 1998 (the earliest available date for all the asset classes listed above). The procedure is to calculate the risk premium for each asset class, compute the annualized return and then add an expected risk-free rate to generate a total return forecast. For the expected risk-free rate, we’re using the latest yield on the 10-year Treasury Inflation Protected Security (TIPS). This yield is considered a market estimate of a risk-free, real (inflation-adjusted) return for a “safe” asset — this “risk-free” rate is also used for all the models outlined below. Note that the BB model used here is (loosely) based on a methodology originally outlined by Ibbotson Associates (a division of Morningstar).

EQ: The Equilibrium model reverse engineers expected return by way of risk. Rather than trying to predict return directly, this model relies on the somewhat more reliable framework of using risk metrics to estimate future performance. The process is relatively robust in the sense that forecasting risk is slightly easier than projecting return. The three inputs:

* An estimate of the overall portfolio’s expected market price of risk, defined as the Sharpe ratio, which is the ratio of risk premia to volatility (standard deviation). Note: the “portfolio” here and throughout is defined as GMI

* The expected volatility (standard deviation) of each asset (GMI’s market components)

* The expected correlation for each asset relative to the portfolio (GMI)

This model for estimating equilibrium returns was initially outlined in a 1974 paper by Professor Bill Sharpe. For a summary, see Gary Brinson’s explanation in Chapter 3 of The Portable MBA in Investment. I also review the model in my book Dynamic Asset Allocation. Note that this methodology initially estimates a risk premium and then adds an expected risk-free rate to arrive at total return forecasts. The expected risk-free rate is outlined in BB above.

ADJ: This methodology is identical to the Equilibrium model (EQ) outlined above with one exception: the forecasts are adjusted based on short-term momentum and longer-term mean reversion factors. Momentum is defined as the current price relative to the trailing 12-month moving average. The mean reversion factor is estimated as the current price relative to the trailing 60-month (5-year) moving average. The equilibrium forecasts are adjusted based on current prices relative to the 12-month and 60-month moving averages. If current prices are above (below) the moving averages, the unadjusted risk premia estimates are decreased (increased). The formula for adjustment is simply taking the inverse of the average of the current price to the two moving averages. For example: if an asset class’s current price is 10% above its 12-month moving average and 20% over its 60-month moving average, the unadjusted forecast is reduced by 15% (the average of 10% and 20%). The logic here is that when prices are relatively high vs. recent history, the equilibrium forecasts are reduced. On the flip side, when prices are relatively low vs. recent history, the equilibrium forecasts are increased.

Avg: This column is a simple average of the three forecasts for each row (asset class)

10yr Ret: For perspective on actual returns, this column shows the trailing 10-year annualized total return for the asset classes through the current target month.

Spread: Average-model forecast less trailing 10-year return.


Major Asset Classes | January 2026 | Performance Review

Commodities and foreign stocks led the performance race in January for the major asset classes, based on a set of ETF proxies. Meanwhile, offshore assets, supported by a weak dollar, outperformed their US counterparts by a wide margin.

A broad measure of commodities led the way higher in January. The iShares S&P GSCI Commodity Indexed Trust (GSG) soared 10.5% last month, marking the fund’s strongest monthly performance in 2-1/2 years.

Foreign stocks were in second and third place in January’s horse race. Developed-market shares ex-US (VEA) rose 6.0%, with stocks in emerging markets (VWO) in close competition via a 5.0% increase.

US stocks (VTI) trailed by a wide margin, rising 1.6% in January. US bonds (BND) only managed to post a thin 0.2% advance. US small-cap stocks, by contrast, delivered strong results, blowing past other slices of US markets with a sizzling 5.7% rise, based on iShares Core S&P Small-Cap ETF (IJR).

Despite a wide array of performances in 2026’s kickoff, January was notable for across-the-board gains for the major asset classes. In 2025, there were three months of rallies in all corners.

The Global Market Index (GMI) kicked off the year with a strong start, jumping 2.4% — its best monthly gain since September. With the latest rise, GMI extended its string of monthly gains to ten in a row, the longest run of wins in eight years. GMI is an unmanaged benchmark (maintained by CapitalSpectator.com) that holds all the major asset classes (except cash) in market-value weights via ETFs and represents a competitive benchmark for multi-asset-class portfolios.


Book Bits: 31 January 2026

It’s on You: How Corporations and Behavioral Scientists Have Convinced Us That We’re to Blame for Society’s Deepest Problems
Nick Chater and George Loewenstein
Summary via publisher (Basic Venture)
Two decades ago, behavioral economics burst from academia to the halls of power, on both sides of the Atlantic, with the promise that correcting individual biases could help transform society. The hope was that governments could deploy a new approach to addressing society’s deepest challenges, from inadequate retirement planning to climate change—gently, but cleverly, nudging people to make choices for their own good and the good of the planet. It was all very convenient, and false. As behavioral scientists Nick Chater and George Loewenstein show in It’s on You, nudges rarely work, and divert us from policies that do. For example, being nudged to switch to green energy doesn’t cut carbon, and it distracts from the real challenge of building a low-carbon economy.

The Global Casino: How Wall Street Gambles with People and the Planet
Ann Pettifor
Summary via publisher (Verso Books)
The global market in money – housed in the offshore ‘shadow’ banking system – holds $217 trillion in financial assets and operates beyond the reach of any nation’s taxman. Asset managers, private equity firms, and pension and sovereign wealth funds scoop up the world’s savings for investment and manage them as they choose, unaccountable to politicians or the citizens who elect them. Ann Pettifor links the activities of remote mobile financial markets to both the cost-of-living and climate crises. In an insane global casino, bankers are gambling with our future. When we foot the bill, no one but a few economists understands what has happened. The result is volatile, unpre­dictable and uncontrollable speculation in global commodities, pension, energy, and housing.

Escape from Capitalism: An Intervention
Clara E. Mattei
Review via Jacobin
In Escape from Capitalism: An Intervention, Clara Mattei dispels the anti-worker ideology that permeated mainstream economists’ analysis of Joe Biden–era inflation. Rather than treating macroeconomic challenges as technical problems with technical fixes, Mattei shows that economics under capitalism is fundamentally political in nature. While central bank technocrats present raising interest rates as a technical solution to inflation, the real effect is to raise unemployment and increase employers’ bargaining power over workers. The power of unelected technocrats to strengthen capitalist power reveals the class character and antidemocratic foundations of the capitalist economy.

Why Socialism Struggles: Exposing the Economic Errors That Undermine Utopian Ideals
Doug Cardell
Summary via publisher (Greenleaf Book Group)
There are few issues more topical these days than government and the economy. Many political and public figures throw around terms like socialism, fascism, and capitalism without knowing what they mean or defining them for their audience. But understanding these systems and their issues is critical in helping Americans decide what ideas and proposals for action they should and should not support. In Why Socialism Struggles, economic policy expert Doug Cardell tackles this hotly debated topic with clarity, logic, and evidence. Doug explains why socialism consistently leads to inefficiency and the erosion of individual freedoms. Each answer builds toward a powerful argument: Despite its appeal in theory, socialism fails in practice because it misunderstands human behavior, incentives, and the role of prices in coordinating economic activity.

Polar War: Submarines, Spies, and the Struggle for Power in a Melting Arctic
Kenneth Rosen
Review via The Economist
Every author dreams of their book capturing the zeitgeist. Kenneth Rosen, a journalist and war correspondent, could not enjoy better timing. “Polar War” comes out just as Mr Trump has propelled the northern region to global attention. The book is a collection of reportage from different sites across the Arctic—from Alaska to the Norwegian island of Svalbard and from Swedish Lapland to Greenland itself. It is knitted together into a story of great powers competing over a region whose harsh geography imposes limits even on the abilities of superpowers.

Please note that the links to books above are affiliate links with Amazon.com and James Picerno (a.k.a. The Capital Spectator) earns money if you buy one of the titles listed. Also note that you will not pay extra for a book even though it generates revenue for The Capital Spectator. By purchasing books through this site, you provide support for The Capital Spectator’s free content. Thank you!

Foreign Bonds Lead US Fixed Income In 2026

Diversifying into foreign bond markets has been a winning trade for US investors during the opening month of 2026. Using a set of ETFs to track performance highlights widespread outperformance so far this year over US bonds, based on returns through yesterday’s close (Jan. 29).

Leading the field by a wide margin: inflation-indexed government bonds outside the US. The SPDR FTSE International Government Inflation-Protected Bond ETF (WIP) is up a strong 4.5% this year, well ahead of other slices of foreign fixed income as well as its US equivalent (TIP).

Notably, all the foreign bond ETFs in the chart below are outperforming the US investment-grade fixed-income benchmark: Vanguard Total Bond Market (BND), which is posting a fractional a 0.3% gain.

A weak US dollar has been a strong tailwind for foreign assets lately, including bonds. Consider that WIP’s 4.5% year-to-date rally has been accompanied by 1.6% loss in an ETF proxy (UUP) for the greenback so far in 2026.

Inflation is another concern that’s supporting WIP, a risk factor that’s come into sharper focus lately as debt levels in several of the major economies around the world are at or near record levels. As a result, governments are paying out higher levels of interest, which further lifts debt loads and threatens to raise inflation.

The International Monetary Fund estimates that in six of the seven G7 nations – a group of the wealthiest countries, including the US – government debt matches or exceeds economic output.

Amid worries about the fiscal path ahead, investors are increasingly seeking refuge in inflation-hedged securities for bond-market allocations. The sentiment shift is also a factor driving gold prices higher – the SPDR Gold Shares ETF (GLD) has soared 25% so far in 2026, reflecting a growing appetite to own an asset that’s immune to fiscal risk and the fragilities linked to fiat currencies.

“The World Economy Is Hooked on Government Debt,” reports The Wall Street Journal this week. “It’s a red flag. It’s another symptom of the vulnerabilities bubbling under the surface of advanced economies,” said Neil Shearing, chief economist at Capital Economics in London.

Is Recession Risk Rising? Monitor the outlook with a subscription to:
The US Business Cycle Risk Report

The Fed’s Job Isn’t Getting Any Easier

The Federal Reserve left interest rates unchanged yesterday, as expected, but the challenges are increasing for identifying the right monetary policy for the path ahead.

It’s tempting to think otherwise after reading the Fed statement issued on Wednesday: “Available indicators suggest that economic activity has been expanding at a solid pace. Job gains have remained low, and the unemployment rate has shown some signs of stabilization. Inflation remains somewhat elevated.”

Hardly ideal, but good enough to leave the Fed’s target rate steady at a 3.5%-to-3.75% and argue that the central bank’s policy matches an economy that’s stabilized and growing. But the risks of a policy mistake may be growing. The bad news is that it’s not obvious what type of mistake is lurking as it continues to juggle the threat of inflation against a softer labor market.

For now, the Fed still seems to be betting that the recently stalled moderation of inflation will resume a downward path in the months ahead, paving the way for more rate cuts. Running the latest Fed statement through an AI program (with access to the historical economic data and analysis) suggests a bias for more cuts in the year ahead, per the chart below.


The Fed funds futures market is more cautious on the outlook, but sentiment is pricing in a resumption of rate cuts starting in June.

The policy-sensitive US 2-year yield is cautiously on board with a dovish policy path… maybe. This yield, which is widely followed as a proxy for policy expectations, ticked lower again yesterday, dipping to 3.58%, or close to the lower range of the Fed’s target rate.

The core of the case for favoring more rate cuts is, as the Fed statement termed it, “low” job gains of late. The tricky part is that while hiring has slowed, layoffs have remained low and “the unemployment rate has shown some signs of stabilization,” the FOMC statement notes. In other words, current conditions leave room for debate about whether a “normal” business-cycle process is playing out that requires rate cuts to offset a downshifting labor market.

The jury’s still out on how to interpret the slowdown in hiring. One line of reasoning is that the labor supply has fallen to the point that the breakeven level for job creation – the number of monthly payrolls jobs required to maintain a stable unemployment rate – has declined. By some accounts, the breakeven jobs level has fallen from 100,000-150,000 new hires a month in the recent past to 30,000 to 60,000 in late-2025.

On that basis, the labor market can slow without raising recession risk, or so the theory goes. A degree of support for this assumption can be found in the relatively stable and low unemployment rate – 4.4% as of December – and a low level of jobless claims, which totaled 200,000 for the week through Jan. 17, which is near the lowest level in four years.

If a softer labor market isn’t a threat to the economy that it appears to be, that opens the door to leave interest rates steady. In turn, inflation can be the main focus for the Fed, but here, too, the outlook is cloudy as economists continue to struggle to explain recent history and use that analysis to project the near-term outlook.

The Fed’s preferred measure of inflation – the PCE price index – suggests that pricing pressure has turned sticky in the upper 2% range, which is moderately above the Fed’s 2% target. The dilemma is that more rate cuts could keep inflation moderately elevated, if not provide more fuel to move the pricing trend higher later in the year.

The 10-year Treasury yield appears to be picking up on the potential for inflation risk. The benchmark rate, after bottoming in October at roughly 3.95%, has been gradually trending up, closing yesterday at 4.25%. A similar rise has been unfolding with the 30-year yield, the most inflation-sensitive maturity.

Part of the reason why long rates have been edging up isn’t inflation per se. The outlook for economic activity has improved and recession fears have receded. The Atlanta Fed’s GDPNow model is nowcasting that the upcoming (and delayed) fourth-quarter GDP report will show an ongoing acceleration in output. Other nowcasts for Q4 indicate a softer pace of growth, but the common denominator is that the odds that a recession has started, or is imminent, are low if not nil. An early read on the Dallas Fed’s Weekly Economic Index (WEI) also points to comparable growth compared with recent history. An early estimate of economic conditions for January (as of Jan. 17) also point to an ongoing expansion, based the Dallas Fed’s Weekly Economic Index.

The Fed’s challenge is deciding if inflation or a slower labor market is the bigger risk. That’s always a judgment call, but it’s especially challenging these days, and it comes with a particular set of issues since the central bank can’t effectively combat both risks at the same time.

A critical component in the mix is how the bond market interprets the Fed’s policy decisions going forward. Using the 10-year yield as a guide, the crowd appears to be increasingly skeptical that rate cuts are warranted. The benchmark rate’s recent rise could be noise, but if it continues to trend up the macro calculus could change, perhaps dramatically.

A key level to watch: 4.30%. If the 10-year yield breaks above this level, and keeps on running, the Fed may be forced to revise its policy plans.


Is Weak Consumer Sentiment Flashing A Economic Warning?

Confidence in the economy fell sharply in January, slumping to a 12-year low, according to the Conference Board latest survey data. On its face, the sharp drop raises questions about consumer spending in the months ahead. But until there’s confirmation in the hard data, it’s best to view the polling cautiously and look for supporting context in other numbers.

The surprise drop in the Consumer Confidence Index (CCI) for this month could be an early warning for the economy, which is powered by consumer spending. But history suggests reserving judgment is sensible when you consider that the relationship between survey data and the economy is weak.

It could be different this time, of course, but it’s too early to confidently make that call. Nonetheless, the latest results are worrisome. “Confidence collapsed in January, as consumer concerns about both the present situation and expectations for the future deepened,” said Dana Peterson, chief economist at The Conference Board. “All five components of the Index deteriorated, driving the overall Index to its lowest level since May 2014 (82.2) — surpassing its COVID-19 pandemic depths.”

To gauge if CCI is noise or signal for near term it’s essential to look for confirmation in other data sets, and on that point the numbers from elsewhere still leave plenty of room for debate. Let’s start with an alternative measure of the mood on Main Street via Consumer Sentiment Index: the University of Michigan’s polling also shows subdued sentiment in January, hovering near the lowest level since 2022. But the Consumer Sentiment Index turned up this month. Here, too, there are concerning signs, but the latest reading suggests that not much changed this month vs. recent history.

Turning to hard data on spending paints a brighter picture, albeit one based on lagging numbers due to the government shutdown. Looking through the short-term noise, the year-over-year change in personal consumption expenditures rose 5.4% through November, a middling pace relative to previous months in 2025.

A more timely update of consumer spending habits also shows that the recent bias for growth continues. The Redbook Index tracks same-store sales and the 7.1% year-over-year increase through Jan. 24 is in line with results over the past several months.

Turning to the broader economic trend, the Dallas Fed’s Weekly Economic Index (WEI) also points to comparable growth compared with recent history. Reporting on data through Jan. 17, WEI continues to print at 2%-plus reading, which is in line with the relatively solid 2.3% four-quarter GDP growth through third quarter 2025.

As for the upcoming (and delayed) fourth-quarter GDP report, the current debate is whether growth accelerated (per the Atlanta Fed’s GDPNow model), or slowed to a moderate but still-encouraging pace, as indicated by the median of several nowcasts, as The Capital Spectator reported on Friday.

Given the preponderance of relatively upbeat data beyond polling consumers, the hard numbers suggest we should be wary of reading too much in mood measures on Main Street for managing economic expectations.

“Admittedly, the expectations index has greatly overstated the weakness in spending in recent quarters,” said Oliver Allen, senior U.S. economist at Pantheon Macroeconomics. “But we’d ‌be surprised if its recent deterioration proves to be an entirely false signal, particularly given the recent stagnation in real incomes and the already rock-bottom personal saving ​rate.”

Fair enough. But until the implied warnings in consumer surveys start resonating in other data sets, it’s still best to take a trust-but-verify approach to polling-based warnings.

Is Recession Risk Rising? Monitor the outlook with a subscription to:
The US Business Cycle Risk Report

Fed Rate Cuts On Hold Till June, According To Market Forecasts

The Federal Reserve is expected to leave its target rate unchanged at tomorrow’s policy meeting, marking a shift after three straight cuts in 2025. Keeping rates steady is the current outlook until June, but several factors are in play that could change the calculus in the weeks ahead.

Let’s start with what appears likely: the Fed funds futures market is pricing in a high probability that the central bank will keep its target rate steady at a 3.5%-to-3.75% range at tomorrow’s FOMC meeting.

The policy-sensitive 2-year Treasury yield is aligned with the no-change outlook. The difference between this widely-followed yield and the current effective Fed funds (EFF) rate is close to the smallest spread in nearly a year. That’s a sign that this slice of the Treasury market is no longer anticipating rate cuts, which was the case in previous months, when the 2-year yield traded well below EFF – falling below -80 basis points at one point last May.

As always, the outlook turns increasingly cloudy the further beyond the next FOMC meeting we look, but a host of conflicting factors make looking ahead unusually challenging.

One source for thinking that the Fed will be hard pressed to cut rates anytime soon: US economic activity has remained resilient, which suggests that easing policy further is unnecessary if not inflationary.

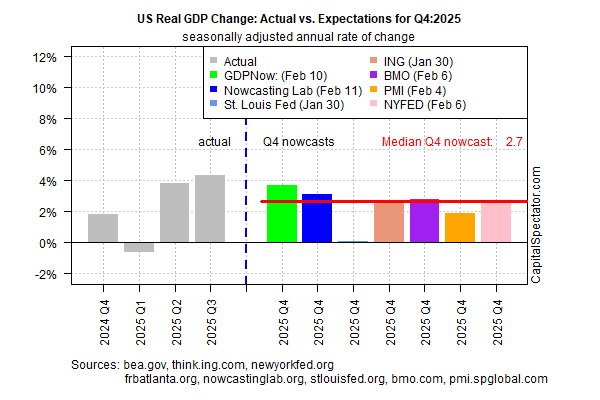
Although some economists last year warned that recession risk was rising, recent nowcasts for the upcoming (and delayed) fourth-quarter GDP report are pointing to ongoing strength. The Atlanta Fed’s GDPNow model is currently nowcasting that Q4 growth will accelerate to 5.4%, which (if correct) would mark the highest output in four years.

Analysts warn that developing relatively reliable Q4 nowcasts is still challenging because of the lingering effects from the government shutdown in October. But as The Capital Spectator reported last week, taking a more cautious view of Q4 nowcasts, by using a median estimate from several sources, still points to a relatively robust, if slower economy in the final three months of 2025. On that basis, there’s arguabbly still a case for going slow with policy changes, if not pausing rate cuts.

Peter Hooper, vice chair of research at Deutsche Bank, agrees. “It’s time to sit back and take a look at things,” he tells The New York Times. “We will get some further easing, but it’s not urgent at this point.”

The counterview is that inflation, for all the concern surrounding a tariff-driven shock, remains relatively stable, which in turn leaves room for more rate cuts, if only as insurance to keep the economy humming. Last week’s delayed update of November’s personal consumption expenditures price index – the Fed’s preferred measure of inflation – ticked up to a 2.8% year-over-year pace for headline and core readings. That’s up from 2.7% in October, and slightly further above the Fed’s 2% target.

The Richmond Fed’s analysis of the latest monthly PCE numbers in context with the historical record, however, suggest that “inflation is behaving as it did prior to the pandemic, in a manner broadly consistent with — or slightly below — the Fed’s 2 percent target.”

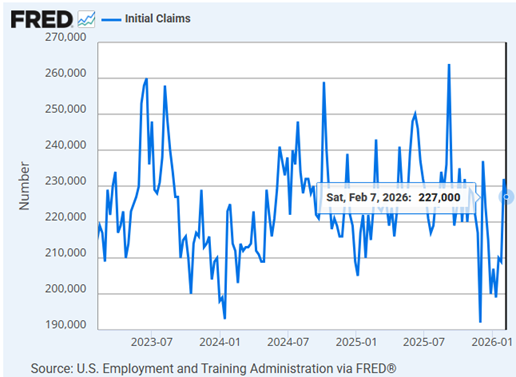
Meanwhile, the jury’s still out on whether the recent updates showing a slowdown in hiring is sign of a broader economic slowdown in progress. Some economists say that the marked downshift in payrolls growth warrants more rate cuts. The pushback is that softer hiring has yet to translate to a rise in layoffs, as indicated by the low level of jobless claims in recent months.

Adding to the Fed’s challenge of setting rates in a complex macro environment is the ongoing political pressure from the White House to ease policy further. President Trump last week renewed his criticism of Fed Chair Jerome Powell and told CNBC that inflation had been “defeated.”

Perhaps the Fed’s biggest challenge is persuading markets that, whatever the central bank decides in the months ahead, it’s setting rates based on independent analysis of the economy. That’s getting harder at a time of an ongoing criminal investigation of Fed Governor Lisa Cook, which some observers say is a thinly-veiled effort by the White House to influence the central bank’s decisions in favor of more rate cuts by opening up a new seat at the Fed.

Further roiling the outlook: Powell’s tenure as Fed chair ends in May, and it’s unclear how a new Fed chair would influence policy.

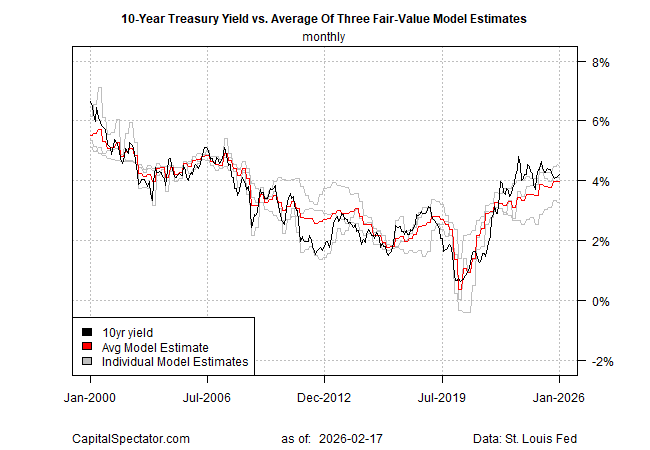
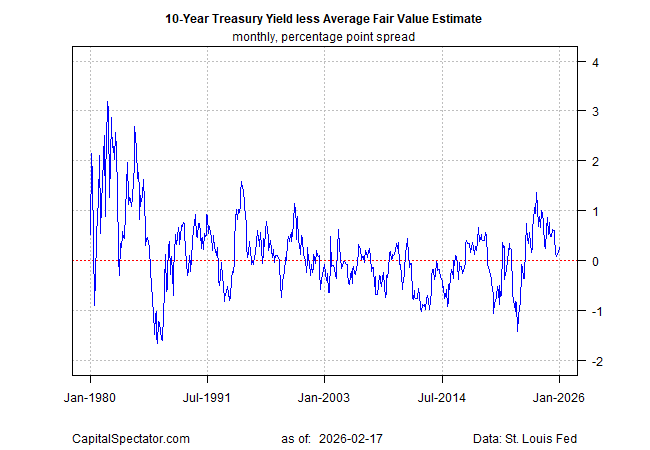
So far, however, the Treasury market appears relatively calm, and so it can be argued that the crowd isn’t particularly worried. The benchmark 10-year yield, although it’s increased lately to the highest level since August a few days ago, is still trading at a middling range vs. recent history.

A rise in this key yield above its recent trading range could change the calculus, perhaps dramatically. All the more so at a time of growing concern about government debt around the world.

The rise of gold above $5000 an ounce this week highlights the growing concerns related to the so-called debasement.

“We’re at the start of a global debt crisis, with markets increasingly fearful governments will attempt to inflate away out-of-control debt,” wrote Robin Brooks, a senior fellow at the Brookings Institution and former chief economist at the Institute of International Finance.

For now, at least, the Treasury market has yet to signal trouble ahead in the form of persistently rising yields. When and if that changes, the risk calculus will change. The challenge of the moment is deciding if this is the calm before the storm, or just another round of noise driven by overbaked warnings.

Is Recession Risk Rising? Monitor the outlook with a subscription to:
The US Business Cycle Risk Report

Commodities Lead Major Asset Classes So Far In 2026

Prices for raw materials have rocketed higher so far this year, outperforming the rest of the major asset classes by a wide margin through Friday’s close (Jan. 23), based on a set of ETFs. Foreign stocks are currently strong, but they remain distant second‑place winners.

The Wisdom Tree Commodity Index Fund (GCC) has surged 10.7% year to date. GCC maintains a relatively diversified portfolio and so it’s not overly dependent on oil and energy, in contrast with some of its competitors. As a result, GCC’s bull run of late highlights that commodities overall are posting strong gains.

In second place this year: foreign equities, led by stocks in emerging markets (VWO) via a 5.6% return. In close pursuit: shares in developed markets ex-US (VEA), which are up 5.3%.

All the major asset classes are posting gains this year, albeit delivering a wide spectrum of results. A broad measure of the US investment-grade bond market, including Treasuries, is the weakest performer in 2026, rising a thin 0.2%, based on the Vanguard Total Bond Market ETF (BND).

US stocks are a middling performer year to date, rising 1.6% via Vanguard Total US Stock Market ETF (VTI).

Within the commodities space, precious metals are especially hot. The SPDR Gold Shares (GLD) have soared 15.6% in 2026 through Friday’s close. Early trading today (Jan. 26) point to a further rally this week as the price of the metal trades well above $5,000 an ounce for the first time. Silver (SLV) is even hotter, skyrocketing more than 44% so far in 2026.

“The rise in precious metals prices is breathtaking and profoundly scary,” wrote Robin Brooks, a senior fellow at the Brookings Institution on Sunday. The rally is “part of something much bigger,” he advised. “We’re at the start of a global debt crisis, with markets increasingly fearful governments will attempt to inflate away out-of-control debt.”

CNBC, citing a Goldman Sachs report, notes: the demand base for gold has broadened and Western ETF holdings have climbed by about 500 tons since the start of 2025.

A key factor in gold’s rally: a weak US dollar. The two assets tend to move inversely with one another. The US Dollar Index fell 1.2% this year through Friday’s close, and has declined nearly 10% over the past year.

Morningstar.com warns against chasing gold after such a strong run, but some analysts still expect higher prices in the near term.

“I think [gold] could well have some further upside,” said Steve Miller, an investment strategy adviser at GSFM, an Australia-based asset manager. “But just as good is it might insulate you from turmoil in other asset classes.”


Pages