The Capital Spectator

Commodities Lead Major Asset Classes By Wide Margin This Year

The war in Iran has roiled the outlook for financial markets and the global economy, but commodities are clearly benefiting from the turmoil as prices rise for energy and other raw materials.

The shift in leadership for the major asset classes has turned sharply in favor of a broad measure of commodities, based on a set of ETFs through yesterday’s close (Mar. 11). The WisdomTree Enhanced Commodity Strategy Fund (GCC) is up 15.3% year to date, far ahead of the rest of the field.

Running at a distant second place this year: foreign stocks in developed countries ex-US (VEA), which is up 5.4% in 2026. VEA had been the year’s top performer, but in line with equities just about everywhere, the war has triggered selling in risk assets. To date the retreat has been moderate, but the extent of the damage to the risk appetite remains unclear as long as the war continues.

Commodities are the exception. Energy is the main beneficiary of the fighting, which has disrupted oil exports from the Gulf region. The interruption of energy flows has spilled over into other areas that are affecting supply chains in some agricultural sectors, for example.

Various metals are also in the crosshairs. “The Gulf is a major supplier of aluminum, and disruptions could tighten supply chains for advanced manufacturing,” said Tony Pelli, practice director of supply chain security and resilience at BSI Consulting, a global risk management firm. “Aluminum prices are already rising, and further disruption could increase input costs for automotive, aerospace, and construction manufacturing in the US and Europe.”

Soaring energy prices will likely fall once the war ends, but as of this writing the odds still appear low that the conflict will cease in the immediate future. Meanwhile, energy markets continue to price in a worst-case scenario. Oil prices rose in early trading on Thursday despite a coordinated announcement the day before from world leaders to release 400 million barrels of oil from their strategic reserves.

Economists are struggling to estimate the breadth and depth of the war’s effects on the global economy, but you don’t need sophisticated models to recognize that the negative consequences will continue until the hostilities end.

“If this disruption goes on longer, we will see faster drawdowns [of existing oil supplies],” said Amin Nasser, head of state-owned oil giant Saudi Aramco. “There would be catastrophic consequences for the world’s oil market, and even more drastic consequences for the global economy.”

There’s never a good time for war, but the current crisis comes at a time of pre-existing macro challenges for the US economy. Economists at Wells Fargo sum up the situation in a research note published on Wednesday:

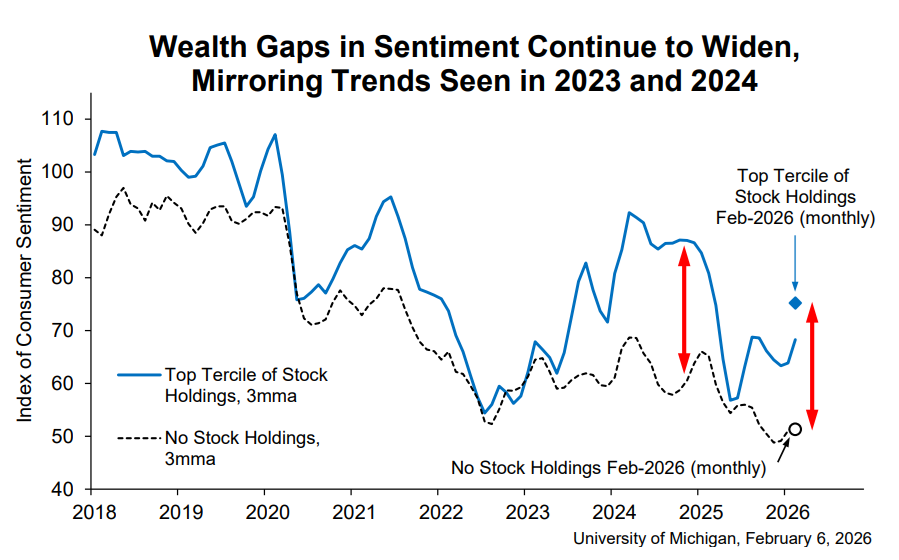
Independent of the oil price spike, employment growth has effectively stalled over the past year, with payroll levels treading water amid weak hiring outside a handful of industries (Figure 2). At the same time, real personal income excluding transfer payments—a metric closely watched by the National Bureau of Economic Research recession dating committee—has lost momentum as wage growth has slowed and inflation has remained sticky. A renewed rise in energy prices would likely push inflation back above 3% in the near term, mechanically eroding real income and placing additional strain on households, particularly the lower- and middle-income households that tend to allocate a greater share of spending to fuel costs.

The good news is that the repair and recovery will likely start as soon as the conflict winds down. Unfortunately, that point doesn’t appear imminent.  

“If the hostilities wrap up in relatively short order, we see little reason for investors to expect a lasting market impact,” predict strategists at Alliance Bernstein. “That’s largely because the economic impact wouldn’t be lasting either. But geopolitical conflicts are complex and unpredictable. If things drag out, the situation—and our assessment of the impact—could change. Time will tell.”


The War May End Soon, But the Fed’s Battle Is Only Beginning

Before the attack started on Feb. 28, lingering concerns about inflation had kept the Fed wary of extending last year’s interest rate cuts. Although several measures of pricing pressure had stabilized at lower levels relative to recent history, Fed officials expressed caution about declaring victory in fully taming the price spike that peaked at 9.0% year over year for the Consumer Price Index in June 2022.

The inflation trend has since fallen dramatically, and remained relatively stable in the mid-2% range, which is modestly above the Fed’s 2% target. But the cautious optimism that had accompanied the disinflation could be ancient history due to the war.

The concern is that the sharp rise in energy costs will reignite inflation and force the central bank to react by keeping monetary policy tighter for longer. It’s uncertain how long the surge in oil, gasoline and natural gas prices will last, and so it’s debatable how, if or when the Fed should respond. This gray area for policy will take time to clear. The longer the war lasts, the deeper the ambiguity about what comes next for policy decisions.

The critical questions: When will the war end, and what will follow in terms of economic consequences? It’s all speculation at this point, but analysts are considering an array of possibilities. Much of the analysis centers on how soon oil exports will rebound through the Strait of Hormuz, which remains essentially closed due to the war, and accounts for roughly one-fifth of the world’s seaborne exports. The basic calculus: the longer exports are blocked, the bigger the hit on supply, which in turn will bring longer-lasting upside pressure to energy prices, estimates Capital Economics via the FT.

The challenge for the Fed is deciding which scenario is likely, and setting monetary policy appropriately. But with no clear end to war in sight as of this writing, the near-term outlook is as cloudy as ever for energy costs and the implications for inflation and economic growth.

Markets are struggling to price in the possible scenarios and insteada are favoring a wait-and-see approach. Consider the policy-sensitive US 2-year Treasury yield, which is widely followed as a proxy for the Fed’s expected policy stance. Unsurprisingly, sentiment has adjusted in recent days so that the 2-year yield is sticking close to the effective Fed funds rate – an implied forecast that the Fed will keep rates steady for the near term.

Fed funds futures reflect a similar outlook and are pricing in expectations that the central bank will leave rates unchanged for the next three policy meetings. The odds start to favor a rate cut in July or September, but those estimates should be viewed cautiously given the depth and breadth of uncertainty at this point about how the war will impact growth and inflation in the months ahead.

“The Fed always has a problem on how to respond to a supply shock,” said Alan Detmeister, a former Fed economist who’s currently at UBS. “On the one hand, the inflationary aspects suggest you should be raising interest rates. On the other, the reduced output and increased unemployment suggest you should be lowering interest rates. It’s not clear, and it just causes the Fed to wait and see which part of their dual mandate they think needs the biggest help.”

In the end, a ceasefire at some point may calm the region, but the potential for economic aftershocks won’t provide clarity for the Fed’s calculus anytime soon.

Is Recession Risk Rising? Monitor the outlook with a subscription to:
The US Business Cycle Risk Report

Most Equity Risk Factors Still Posting Gains For 2026

The war in Iran is increasingly weighing on global financial markets and economic activity. Reflecting the rising macro risk, the major U.S. equity benchmarks have slipped into negative territory for the year. But a closer look at stocks shows that most equity risk factors continue to enjoy positive returns in 2026, based on a set of ETFs through Monday’s close (Mar. 9).

Mid-cap growth (IJK) is leading the field, posting a 6.6% year-to-date gain. Although the fund has slipped in recent days, it traded up yesterday and is just 4.4% below the record high it set last week.

Most of the risk factors that make up the stock market are holding on to gains this year. The two exceptions: momentum (MTUM) and large-cap growth (IVW), which are mainly responsible for pulling the broad equity market indexes into the red this year. The SPDR S&P 500 ETF (SPY), for instance, is down 0.5% in 2026 vs. a 2.8% loss for large-cap growth (IVW).

Although the war so far has had varied effects on different segments of the stock market, the threat to equities will likely rise the longer the conflict continues. Until a solution, diplomatic or otherwise, reopens the shuttered Strait of Hormuz — the transit point for roughly 20%-plus of the world’s oil and liquefied natural gas — a global energy crisis looms, which could in turn trigger a worldwide recession.

The divergence in performance this year highlights a market that is repricing broad macro risk while still rewarding more defensive or structurally resilient styles. The key question for the months ahead is whether the economic drag from higher energy prices, weaker confidence, and tighter financial conditions becomes strong enough to drag down all factor returns down as well. If the macro shock deepens, the current resilience in factor strategies may prove temporary.

There are positive signs emerging. Saudi Aramco, based in Saudi Arabia, says it expects to restore roughly 70% of its usual crude exports within days by rerouting up to 5 million barrels a day through its Red Sea port at Yanbu, allowing shipments to bypass the war‑disrupted Strait of Hormuz.

President Trump on Monday offered an optimistic view that the war is nearing an end. In response to a question about a timeline, he said “very soon.”

Perhaps, but an energy shock is already starting to reverberate across the global economy and the clock is ticking. For now, the effects are most acute in countries that are dependent on oil imports, including South Korea, Taiwan, Japan, India and China, along with much of Europe.

The US, by contrast, is the world’s largest oil producer and a net exporter, providing a degree of immunity from the supply shock. But oil is priced globally, and so the surge in energy prices recognizes no national border.

The energy shock also has implications beyond oil and gas. Joseph Glauber of the International Food Policy Research Institute estimates that up to 30% of global fertilizer exports move through the Strait of Hormuz, and the current disruption is already cutting shipments, raising farm costs, and likely pushing food prices higher.

The key macro risks: higher inflation and slower growth – threats that will strengthen the longer the war disrupts energy markets. The IMF’s managing director, Kristalina Georgieva, estimates that a sustained 10% rise in energy prices would add about 40 basis points to global inflation and trim global growth by 0.1–0.2%.

“This is a very concerning shock to consumers, which have been a driving force in the economy,” said Tim Mahedy, chief economist at Access/Macro, a research firm, formerly at the Federal Reserve Bank of San Francisco. “I am very concerned this could tip us into a recession if it persists.”

Traders at the betting site Polymarket are still downplaying the odds of a US economic downturn this year. The current estimate this morning – 28% – reflects a jump since the war started, but optimism is still intact that growth will prevail.

The crucial variable, of course, is the timeline for the war, and the potential for ongoing repercussions after the fighting stops. Estimating the risk outlook, in short, will remain a day-to-day affair for the foreseeable future.

Tehran Defies US as Conflict Escalates and Markets Reel

Iran named Mojtaba Khamenei to succeed his slain father Ali Khamenei as the country’s supreme leader. The choice sends a signal that the country’s hardliners are still in control of the country and will remain defiant against President Trump’s demand for “unconditional surrender.” With neither side blinking, a quick end to the war, now in its tenth day, still appears elusive.

The main macro effect: oil prices on Sunday soared to nearly $120 a barrel for the US benchmark (West Texas Intermediate) before pulling back to just above $100 in early trading on Monday (Mar. 9). The spike marks the first return to triple-digit pricing in four years.

Assessing the risk outlook for the global economy boils down to a basic calculus: How long can Iran hold out?

The reasonable view: Not long. The combined military might of the US and Israel is vastly superior to Iran’s. But The Islamic Republic is fighting for its survival and is probably reasoning that it has little to gain from acceding to Washington’s demands. Although Iran will surely be transformed when the fighting stops, getting from here to there looks increasingly risky as the regime lashes out in a strategy to inflict maximum damage on the global economy by widening the conflict throughout the Middle East and thereby raising energy prices.

The US will almost certainly “win” in the end, but debate rages about the cost of victory and how the current conflict will reshape the Middle East and the politics of energy supplies.

Escalating the war won’t improve Iran’s odds of winning per se, but it will increase the pressure for a negotiated settlement in some form if public pressure ramps up in the West to end the fighting as a mechanism to lower energy prices.

Among the latest signs of Tehran’s strategy to widen the war, Saudi Arabia reported that its air defenses intercepted a new wave of airstrikes targeting Aramco’s giant Shaybah field. Expect more of these attacks to come.

The US is less vulnerable to an oil shock these days due to an increase in domestic production in recent years, a shift that’s has transformed America into the world’s largest oil producer and a petroleum exporter. In addition, the US economy, like most countries in the West, has become more energy efficient in recent decades and so the amount of oil needed to generate growth has fallen.

Despite this progress, the key macro challenge at the moment is that oil is still priced globally. Yale University Professor William Nordhaus presented a useful metaphor in a 2009 discussion that still applies today:

We can envision the oil market as a giant bathtub. The bathtub contains the world inventory of oil that has been extracted and is available for purchase. There are spigots from Saudi Arabia, Russia, the United States, and other producers that introduce oil into the inventory; and there are drains from which the United States, Japan, Denmark, and other consumers draw oil from the inventory. Nevertheless, the price and quantity dynamics are determined by the sum of these demands and supplies and the level of total inventory, and are independent of whether the faucets and drains are labeled “U.S.,” “Russia,” or “Denmark.”

The main economic risk from the war is stagflation. The longer the conflict lasts, the greater the threat of higher inflation and slower growth – a mix that is especially difficult to address through monetary policy. Raising interest rates can limit if not reduce inflation, but doing so at a time of rising energy costs will likely slow economic growth at a vulnerable time. The opposite is equally unappealing: cutting interest rates to stimulate growth, which could lift inflation even further for longer.

The solution, of course, is to end the war. The main uncertainty is when the economy crosses the Rubicon and an energy shock becomes unavoidable. The good news is that we’re probably not yet at the point of no return.

Market expectations for inflation have increased in recent days, but the current implied estimates via the Treasury market are still trading in the mid-2% range that’s prevailed over the last several years.

Meanwhile, the Dallas Fed’s Weekly Economic Index continues to reflect an upswing in economic activity through the end of February. The current 2.48% reading is slightly above the year-over-year GDP pace through the fourth quarter.

The threat that’s lurking is that the longer the fighting continues, the greater the possibility that the economic damage will deepen and linger.

The betting site Polymarket this morning is pricing in US recession risk for 2026 at 32%. That’s up about ten percentage points since the war started, but it still reflects optimism that growth will endure. So far, so good, the economic outlook will become increasingly precarious with each new day of war.

Is Recession Risk Rising? Monitor the outlook with a subscription to:
The US Business Cycle Risk Report

Book Bits: 7 March 2026

The Coming Storm: Power, Conflict, and Warnings from History
Odd Arne Westad
Interview with author via Keen on America podcast
“If we let things continue in the direction that they are taking now, I think it is more likely than not that we will end up in some kind of Great Power war within the foreseeable future.” — Arne Westad
This conversation was recorded before the invasion of Iran, which makes what you are about to hear even more chilling. In new book, The Coming Storm: Power, Conflict, and Warnings from History, Yale historian Arne Westad warns that the structural parallels between our multipolar 2020s and the world before the First World War are too striking to ignore—and he names the Middle East as one of the flashpoints that could spark a much broader conflagration.

Streetwise: Getting to and Through Goldman Sachs
Lloyd Blankfein
Review via Reuters
Unlike many rivals, Goldman decided to hedge its exposure to U.S. subprime housing debt, in part by buying protection from American International Group (AIG.N), opens new tab against defaults in mortgage-backed securities. When the U.S. government – with Paulson as Treasury Secretary – bailed out the insurance giant in September 2008, many on Wall Street suspected the rescue had indirectly saved Goldman. Blankfein insists that the firm, which had also taken the precaution of buying insurance against an AIG default, would have survived its counterparty’s collapse. Still, whether the banks that sold that protection could have honoured their obligations in such a meltdown remains an open question.
Yet if Blankfein nimbly guided Goldman through the storm, he stumbled in the aftermath. Intense public scrutiny and criticism from politicians came ​as a shock for a firm unused to being a household ​name. Blankfein offers a spirited defence against Goldman’s many critics. ⁠Yet he acknowledges that bailouts helped polarise public opinion, clearing the way for Trump.

Please note that the links to books above are affiliate links with Amazon.com and James Picerno (a.k.a. The Capital Spectator) earns money if you buy one of the titles listed. Also note that you will not pay extra for a book even though it generates revenue for The Capital Spectator. By purchasing books through this site, you provide support for The Capital Spectator’s free content. Thank you!

Early Impact of Iran War Is Low, But Economic Risks Are Rising

The economic fallout from the war in Iran has been limited for the US so far. But as the conflict continues, the effects will become increasingly clear.

The main risks: slower economic growth and higher inflation, driven largely by higher energy prices. It’s too early to confidently estimate how the war will influence those factors, but as the war – one week old tomorrow – persists, the macro price tag will surely rise.

Because economic data is reported with a lag, the blowback will take time to show up in official releases. For next month’s first-quarter GDP release, for instance, even if the war continues through the end of March, the effects may be hard to spot.

The Atlanta Fed’s Mar. 2 nowcast of Q1 GDP: +3.0%, marking a solid rebound from the sluggish 1.4% increase in Q4. Revisions are likely before the official April 30 release, but the war-related impact may be modest, given that the attack began late in the quarter.

February data published earlier in the week underscores ongoing strength in private‑sector hiring and services activity. ADP on Wednesday said that companies added 63,000 jobs last month, the strongest monthly gain since July. Meanwhile, the ISM Services Index rose to its highest growth reading in February in nearly four years.    

The outlook for Q2 is more vulnerable. US and Israeli officials have said the war could continue for several weeks, which would give the inflationary and slower-growth effects more oxygen. The degree and extent of pain these effects could bring is unclear for now, but markets are already reflecting greater caution relative to the pre-war outlook.

One of the clearest signs of shifting sentiment relates to monetary policy. The rate cuts that were priced in via Fed funds futures for June are now seen as unlikely. September is currently the earliest month in which odds favor an initial cut.

Earlier this week, Cleveland Fed President Beth Hammack called for an extended pause on rate cuts. Part of the calculus is that economic activity appears to be firming in Q1. Add in the inflation-related uncertainty from the war and she sees a stronger case for holding rates steady. “I want to see evidence that we are making progress on the inflation side of our mandate to have more confidence in my forecast,” she said.

Treasury yields have remained relatively steady since the war started, trading within the range that’s prevailed in recent months. But the market is starting to pick up on the potential for higher inflation. The policy-sensitive 2-year yield has increased every day this week, rising to 3.59% on Thursday.

Higher yields are likely until there are signs that the war, if not ending, is winding down. For now, the opposite seems to be the likely path ahead for the immediate future.

The FT this morning is reporting: Qatar, the world’s second-largest producer of liquified natural gas, says the war will force Persian Gulf energy exports to end “within days.”

“This will bring down the economies of the world,” predicts Saad al-Kaabi, Qatar’s energy minister. “If this war continues for a few weeks, GDP growth around the world will be impacted. Everybody’s energy price is going to go higher. There will be shortages of some products and there will be a chain reaction of factories that cannot supply.”

Hyperbole? Maybe, but making that case that the fallout will be limited is becoming tougher every day the war continues and energy infrastructure in the Gulf comes under additional strain.

Is Recession Risk Rising? Monitor the outlook with a subscription to:
The US Business Cycle Risk Report

Energy Stocks Are Soaring, Too

The war in Iran has upended expectations about winners and losers in the US stock market, redirecting equity investment flows into energy, materials, and industrials. How long this leadership rotation lasts will likely be determined by the course and duration of the war. Meantime, old‑economy stocks are back in vogue.

Driven by rising oil and gas prices, energy shares are the leading sector performer by far, based on a set of ETFs through yesterday’s close (Mar. 4). The State Street Energy Select Sector SPDR ETF (XLE), a Big Oil proxy, has surged more than 25% year to date. That compares with a near‑flat performance for the broad stock market via the SPDR S&P 500 ETF (SPY), which is holding on to a fractional 0.5% gain so far in 2026.

Materials (XLB) and industrials (XLI) are distant second‑ and third‑place sector performers this year, followed by consumer staples (XLP), utilities (XLU), and real estate (XLRE). The remaining sectors are close to flat or underwater. The biggest loser: financials (XLF), down 6.0% year to date.

The attitude shift could be short‑lived, depending on how the war unfolds from here. Many analysts assume the conflict will end soon, in which case the current sector leaders could lose their performance crowns and a return to AI and digital‑economy themes would ensue.

Perhaps—but it’s already clear that the US and Israeli strike on Iran is no quick surgical attack. The conflict is now five days in and the odds appear low for a resolution in the immediate future.

Both the US and Israel have publicly said that a weeks‑long war is possible, perhaps even likely. Top Pentagon officials on Wednesday warned that the war could become a longer conflict and that the fighting is “far from over.” Defense Secretary Pete Hegseth said the conflict could last as long as eight weeks.

“We’re preparing for several long weeks,” acknowledged a senior Israeli military officer.

The duration of the war is the key variable for risk appetite and how markets evolve from here.

“If disruption is relatively short‑lived, history suggests that price spikes driven by geopolitical tension can fade once uncertainty begins to ease,” said Rick de los Reyes, a sector portfolio manager at T. Rowe Price. “But if production or exports face sustained disruption, that would amount to a genuine supply shock, with implications for inflation, interest rate expectations, and global growth.”

Hanging in the balance is the outlook for inflation, economic growth, interest rates, and the near‑term leaders and laggards in the stock market and other asset classes.

The only certainty now is that no one knows where this is going or how it will unfold. Several reasonable scenarios are plausible on paper. but when the fighting ends, the outcomes will almost certainly overturn many of today’s forecasts.

Is Recession Risk Rising? Monitor the outlook with a subscription to:
The US Business Cycle Risk Report

Energy Prices Are Soaring. How Long Will It Last?

The Iran war has slowed oil exports through the Strait of Hormuz to a crawl, leading to the expected result: a surge in energy prices. So far, so expected. The bigger, more important question: How long will the spike last? The stakes surrounding the answer are high since the path of energy prices could influence an array of macro factors, including economic activity, interest rates and monetary policy.

The US crude oil benchmark (West Texas Intermediate) has increased sharply in trading so far this week, jumping nearly $75 a barrel by the close of trading yesterday (Mar. 3). Year to date, WTI is up 30%, and spot gasoline in the US is trading 44% above its 2025 close.

Crude Risk

The optimistic spin is that once the war is over, energy prices will quickly return to the subdued levels that prevailed before the Iran war dominated trading.

“The primary near-term driver for oil prices remains the US-Iran conflict,” said OANDA senior market analyst Kelvin Wong. “At this stage, only clear signs of de-escalation could mitigate or reverse the current bullish ‌trend for WTI, and such signals are currently lacking.”

The key choke point is the Strait of Hormuz, which is a crucial trade route for energy. A fifth or more of the seaborne oil exports flow through  this narrow channel, whose shores include Iran and Saudi Arabia.

The war has dramatically reduced shipping through the strait. “It’s a de facto closure,” said Dan Pickering, chief investment officer of Pickering Energy Partners, a Houston financial services firm. “You’ve got a significant number of vessels on either side of the strait, but no one is willing to go through.”

Shipping Flow

Attacks on shipping have become “a huge deterrent for all but a few shipping companies and charterers,” said Martin Kelly, head of advisory at maritime intelligence group EOS Risk.

The White House is trying to counter the risk, announcing on Tuesday that the US will “immediately” offer “political risk insurance and guarantees.” President Trump also wrote on social media that “If necessary, the United States Navy will begin escorting tankers through the Strait of Hormuz, as soon as possible.”

The conflict rages on, with few signs of an end game in the immediate future. When it does end, oil shipments could quickly rebound, acting as a downward force on prices as supply rebounds. But that scenario will be threatened if Iran extends and expands attacks on energy infrastructure in the Gulf region. In that case, the squeeze on exports could linger for months.

A key oil refinery in Saudi Arabia and two facilities in Qatar were attacked earlier in the week.

“Gulf energy infrastructure [is] now squarely in Iran’s sights,” said Torbjorn Soltvedt, an analyst at the risk intelligence company Verisk Maplecroft. “An extended period of uncertainty lies ahead as Iran seeks to impose a heavy economic cost by putting tankers, regional energy infrastructure, trade routes and US security partners in the crosshairs.”

Repairing damaged pipelines and refining operations won’t happen overnight. An additional risk: attacks on Saudi Arabia oil infrastructure could trigger retaliatory attacks, which would threaten an escalation in the war.

Asia is especially vulnerable to reduced exports, advises S&P Global: “This is because the majority of exports from the region through the strait are to Asia, namely China and India.”

US Production Will Help Soften The Blow

The US, by comparison, is less vulnerable, thanks to a dramatic increase in domestic oil production in recent years, driven development of shale sources. America energy output has soared, according to US government data. But the odds are reportedly low that American producers will quickly act to increase supply to offset effects of the war in an effort to keep energy prices low.      

The path ahead is as uncertain as it is risky for the global economy. The potential for higher inflation, slower growth, and higher energy prices for an extended period will complicate decisions about monetary policy for central banks and increase the possibility of policy errors.

The path to greater pain, however, is clear. “If this war does continue as long as US President Donald Trump suggests – three or four weeks – there will definitely be a situation where the price of oil will skyrocket which will have adverse impacts on the global economy and more locally for the US,” predicts Arang Keshavarzian, professor of Middle Eastern and Islamic Studies at New York University.


Total Return Forecasts: Major Asset Classes | 3 March 2026

The Iran war is roiling financial markets, but the impact on long‑term expected returns will likely be limited. Even in the worst‑case scenario, the methodology outlined below for developing performance estimates is relatively immune to short‑term events.

As a general rule, expected returns rise (fall) as markets decline (rally), all else equal. Higher market volatility equates with bigger changes for projected returns, of course, but it would take a significant shock to move the needle in a meaningful degree. It’s possible that the war could take a bite out of the risk appetite, and so some degree of improvement in long‑term performance estimates may start to become visible in the months ahead, depending on how far markets slide.

For today’s update, using pre-war monthly numbers through February, the revised long‑term forecast for the Global Market Index (GMI) continued to hold steady at a 7%-plus annualized total return. In line with recent estimates, GMI’s projected long‑run outlook continues to run well below its trailing ten‑year performance, which suggests managing expectations down for performance relative to recent history.

GMI is a market‑value‑weighted mix of the major asset classes (excluding cash) via ETF proxies. Today’s forecast is calculated as the average of three models (defined below). The current 7.3% annualized estimate for GMI is unchanged from the previous update, and remains well below the trailing 10.2% annualized return that GMI has generated over the past decade.

Following a run of strong gains in several asset classes recently, roughly a third of GMI’s components are projected to generate returns that trail results posted over the past ten years (indicated by the red boxes in far-right column below). That gap also applies to GMI, which is currently projected to earn a substantially softer return compared with its performance over the trailing ten‑year window through February.

GMI represents a theoretical benchmark for the “optimal” portfolio that’s suited for the average investor with an infinite time horizon. Accordingly, GMI is useful as a starting point for customizing asset allocation and portfolio design to match a particular investor’s expectations, objectives, risk tolerance, etc. GMI’s history suggests that this passive benchmark’s performance will be competitive with most active asset-allocation strategies, especially after adjusting for risk, trading costs and taxes.

It’s likely that some, most or possibly all of the forecasts above will be wide of the mark in some degree. GMI’s projections, however, are expected to be somewhat more reliable vs. the estimates for its  components. Predictions for the specific markets (US stocks, commodities, etc.) are subject to greater variability compared with aggregating the forecasts into the GMI estimate, a process that may reduce some of the errors through time.

Another way to view the projections above is to use the estimates as a baseline for refining expectations. For instance, the point forecasts above can be adjusted with additional modeling that accounts for other factors and assumptions not used here. Customizing portfolios for a specfic investor, to reflect risk tolerance, time horizon, and so on, is also recommended.

For perspective on how GMI’s realized total return has evolved through time, consider the benchmark’s track record on a rolling 10-year annualized basis. The chart below compares GMI’s performance vs. ETFs tracking US stocks and US bonds through last month. GMI’s current return for the past ten years is a strong annualized 10.2%, a performance that marks the strongest pace for the historical record shown.

Here’s a brief summary of how the forecasts are generated and definitions of the other metrics in the table above:

BB: The Building Block model uses historical returns as a proxy for estimating the future. The sample period used starts in January 1998 (the earliest available date for all the asset classes listed above). The procedure is to calculate the risk premium for each asset class, compute the annualized return and then add an expected risk-free rate to generate a total return forecast. For the expected risk-free rate, we’re using the latest yield on the 10-year Treasury Inflation Protected Security (TIPS). This yield is considered a market estimate of a risk-free, real (inflation-adjusted) return for a “safe” asset — this “risk-free” rate is also used for all the models outlined below. Note that the BB model used here is (loosely) based on a methodology originally outlined by Ibbotson Associates (a division of Morningstar).

EQ: The Equilibrium model reverse engineers expected return by way of risk. Rather than trying to predict return directly, this model relies on the somewhat more reliable framework of using risk metrics to estimate future performance. The process is relatively robust in the sense that forecasting risk is slightly easier than projecting return. The three inputs:

* An estimate of the overall portfolio’s expected market price of risk, defined as the Sharpe ratio, which is the ratio of risk premia to volatility (standard deviation). Note: the “portfolio” here and throughout is defined as GMI

* The expected volatility (standard deviation) of each asset (GMI’s market components)

* The expected correlation for each asset relative to the portfolio (GMI)

This model for estimating equilibrium returns was initially outlined in a 1974 paper by Professor Bill Sharpe. For a summary, see Gary Brinson’s explanation in Chapter 3 of The Portable MBA in Investment. I also review the model in my book Dynamic Asset Allocation. Note that this methodology initially estimates a risk premium and then adds an expected risk-free rate to arrive at total return forecasts. The expected risk-free rate is outlined in BB above.

ADJ: This methodology is identical to the Equilibrium model (EQ) outlined above with one exception: the forecasts are adjusted based on short-term momentum and longer-term mean reversion factors. Momentum is defined as the current price relative to the trailing 12-month moving average. The mean reversion factor is estimated as the current price relative to the trailing 60-month (5-year) moving average. The equilibrium forecasts are adjusted based on current prices relative to the 12-month and 60-month moving averages. If current prices are above (below) the moving averages, the unadjusted risk premia estimates are decreased (increased). The formula for adjustment is simply taking the inverse of the average of the current price to the two moving averages. For example: if an asset class’s current price is 10% above its 12-month moving average and 20% over its 60-month moving average, the unadjusted forecast is reduced by 15% (the average of 10% and 20%). The logic here is that when prices are relatively high vs. recent history, the equilibrium forecasts are reduced. On the flip side, when prices are relatively low vs. recent history, the equilibrium forecasts are increased.

Avg: This column is a simple average of the three forecasts for each row (asset class)

10yr Ret: For perspective on actual returns, this column shows the trailing 10-year annualized total return for the asset classes through the current target month.

Spread: Average-model forecast less trailing 10-year return.


Major Asset Classes | February 2026 | Performance Review

Foreign securities and US real estate investment trusts led a broad-based rally for the major asset classes in February, based on a set of ETF proxies. US stocks, however, didn’t participate in last month’s gains.

Foreign developed shares ex-US (VEA) led the field, posting a strong 6.1% gain in February–the ETF’s best monthly advance in more than two years. Year to date, this slice of global equities is up 12.4%, just behind the 2026 performance leader: a 12.6% rise for commodities (GSG).

US stocks (VTI) were the lone loser last month, edging down 0.5%. So far this year, US shares are up just 1.0%, which is close to the weakest performance for the major asset classes.

Notably, gains still prevail across the board for the trailing 1- and 3-year windows. But the outlook has suddenly turned cloudy in the wake of the US-Israel military strike on Iran, introducing a new phased of uncertainty for March and beyond.

Meanwhile, the Global Market Index (GMI) extended its bull run in February, rising 1.3%, marking the 11th straight monthly gain – the longest rally in nine years.

GMI is an unmanaged benchmark (maintained by CapitalSpectator.com) that holds all the major asset classes (except cash) in market-value weights via ETFs and represents a competitive benchmark for globally diversified, multi-asset-class portfolio strategies.

Learn To Use R For Portfolio Analysis
Quantitative Investment Portfolio Analytics In R:
An Introduction To R For Modeling Portfolio Risk and Return

By James Picerno

Iran Risk Threatens The Everything Rally

All the major asset classes are posting year-to-date gains, as of Friday’s close. But a lot can happen over one weekend.

The US-Israel military strike on Iran is ongoing and appears set to continue for days, possibly weeks. No one knows how this will play out in markets beyond the immediate future, but it’s reasonable to assume that the bullish sentiment, which was already showing signs of fatigue in some corners, could become collateral damage the Middle East conflict.

Foreign stocks and commodities are the performance leaders in 2026 through Friday’s close (Feb. 27), based on a set of ETFs. But last week’s assumptions about the future suddenly look like ancient history.

The crucial question: How vulnerable is the world economy? The short answer: blowback risk will increase the longer the war lasts. At the moment, the odds appear low for a quick cessation of hostilities as the war widens across the Middle East, which include Iran’s attack on oil infrastructure in Saudi Arabia.

“The attack on Saudi Arabia’s Ras Tanura refinery marks a significant escalation, with Gulf energy infrastructure now squarely in Iran’s sights,” said Torbjorn Soltvedt, an analyst at the risk intelligence company Verisk Maplecroft. “An extended period of uncertainty lies ahead as Iran seeks to impose a heavy economic cost by putting tankers, regional energy infrastructure, trade routes and U.S. security partners in the crosshairs.”

The economic costs for the global economy could be significant if the conflict lingers and oil prices stay elevated. Roughly 31% of all seaborne oil flowed through the Strait of Hormuz in 2025, according to analysis by Kpler, a data analytics firm. Those flows are vulnerable due to Iran’s strategic location, which allows it to disrupt if not halt shipping through the waterway.

“The implications of this conflict for the world economy depend on the flow of oil and gas through the Strait of Hormuz,” said Norbert Rücker, head of economics at Julius Baer. “The most feared scenario is not its closure, but serious damage to the region’s key oil and gas infrastructure.”

Kpler advises: “Any meaningful closure – or even a sustained de facto closure driven by insurance withdrawal – would trigger supply shocks across multiple commodity classes simultaneously.”

How long will the conflict last? No one knows, but on Sunday President Trump said the military operation could “take four weeks or less.”

Unsurprisingly, oil is rising today. The international Brent benchmark is near $78 a barrel this morning, the highest in over a year.

The Trump administration’s goal of regime change for Iran suggests a prolonged war. “I call upon all Iranian patriots who yearn for freedom to seize this moment … and take back your country,” Trump said on Sunday.

Regime change won’t be easy. Although Iran’s supreme leader, Ayatollah Ali Khamenei, was killed by airstrikes on Saturday, the country’s paramilitary Revolutionary Guard remains a powerful force and has likely prepared for a long struggle following a series of previous attacks on the country by the US and Israel. Airstrikes alone are unlikely to topple the regime’s praetorian guard that’s oversees Iran’s leading military force with sprawling economic interests to finance its operations.

“At the end of the day, once US and Israeli strikes stop, if the Iranian people come out, their success in promoting the end of the regime will depend on the rank and file standing aside or aligning with them,” said Jonathan Panikoff, a former US intelligence official who is now at the Atlantic Council think tank in Washington. “Otherwise, the remnants of the regime, those with the weapons, are likely to use them to keep power.”

Regime change in Iran is currently estimated as moderately unlikely, with a 42% chance, according to the latest betting data at Polymarket. The implication, the prospects appear weak for a quick end to the conflict until one side blinks first.

Looking beyond the next several weeks changes the calculus, according to Sanam Vakil, director of the Middle East and North Africa Program at Chatham House, a London-based research group. “The Islamic Republic as we know it will not survive this,” he predicts.

If so, the main issue is what replaces the current regime and does the change promote stability or chaos in Iran and across the Middle East?

Is Recession Risk Rising? Monitor the outlook with a subscription to:
The US Business Cycle Risk Report

Book Bits: 28 February 2026

Plastic Inc.: The Secret History and Shocking Future of Big Oil’s Biggest Bet
Beth Gardiner
Summary via publisher (Avery/Penguin Random House)
Plastic, the foundational material of modern consumerism, is everywhere in our daily lives. But the oil and petrochemical companies making it are hiding in plain sight. Because for all the vivid coverage of where plastic ends up, there is remarkably little discussion of where it comes from. Today, industry is pouring billions of dollars into plans to double, or even triple, the amount it churns out, even as individuals concerned about plastic’s out-of-control proliferation try to use less. As Big Oil stares down a future of diminishing demand for fossil fuels, plastic has become its financial lifeline.

Wired on Wall Street: The Rise and Fall of Tipper X, One of the FBI’s Most Prolific Informants
Tom Hardin
Summary via publisher (Wiley)
Part financial crime thriller, part personal transformation story, and part redemption memoir, Wired on Wall Street: The Rise and Fall of Tipper X, One of the FBI’s Most Prolific Informants tells the riveting true story of Tom Hardin, a young hedge fund analyst turned FBI informant. Known as “Tipper X,” Tom wore a covert wire over 40 times, helping the FBI build more than 20 of the 80+ cases in Operation Perfect Hedge, the largest insider trading investigation in a generation. As the youngest professional caught in the sting, Tom navigated the psychological toll of betrayal, secrecy, and public disgrace. What followed was a powerful journey through shame, fatherhood, and ultimately, personal transformation.

Please note that the links to books above are affiliate links with Amazon.com and James Picerno (a.k.a. The Capital Spectator) earns money if you buy one of the titles listed. Also note that you will not pay extra for a book even though it generates revenue for The Capital Spectator. By purchasing books through this site, you provide support for The Capital Spectator’s free content. Thank you!

CEOs vs. the Treasury Market

CEO confidence for the economic outlook has improved, but the Treasury market is still pricing in rate cuts.

The Conference Board reports that confidence among CEOs “surged” to the highest level in a year. “CEO Confidence improved significantly in the first quarter of 2026, reflecting restored optimism among leaders of large firms,” said Dana Peterson, chief economist at the consultancy.

The rebound in CEO optimism implies that the case for more Fed rate cuts has weakened. The Treasury market, however, has yet to be persuaded. The policy-sensitive 2‑year yield traded down yesterday to 3.44% (Feb. 26), holding near the lowest level in nearly four years and slightly below the current 3.50%–3.75% Fed funds target range.

Fed funds futures are still pricing in a pause in rate cuts for the next two policy meetings, but anticipate another rate cut in June. Sticky inflation data and a steady, low jobless rate may complicate that forecast for a near-term cut. Markets will pay close attention to next week’s payrolls report for February, looking for new clues on where monetary policy is headed.

Another key variable is Kevin Warsh, the incoming Fed chair, who will take over the central bank’s leadership in May. Analysts are debating whether Warsh will tilt dovish to support President Trump’s demands for lower interest rates.

A complicating factor is the current nowcast for a rebound in economic growth for the first quarter. The Atlanta Fed’s GDPNow model, for example, is currently estimating that GDP will rise 3.1% in the first three months of this year, up sharply from Q4’s sluggish 1.4% increase.

The rise of artificial intelligence as an economic input is another variable that’s muddling the outlook. “The question is how is AI going to be inflationary and maybe the long end of the curve is sniffing all of this out,” said Jack McIntyre, portfolio manager at Brandywine Global Investment Management. “The only inflationary aspect of AI is the building out of data centers and the associated energy needs, and that is known.”

If CEOs are right and growth is re-accelerating, the Treasury market is mispriced. If the bond market is right, CEO optimism is a head fake. With Warsh stepping in and AI reshaping the inflation debate, investors won’t have to wait long to find out who blinked first.

Is Recession Risk Rising? Monitor the outlook with a subscription to:
The US Business Cycle Risk Report

Bullish Momentum Holds Firm in Global Asset Allocation

Optimism may seem scarce in the headlines, but a bullish trend still powers global asset‑allocation strategies, based on a set of ETFs through yesterday’s close (Feb. 25).

Although the risk appetite from a global perspective has periodically wavered in recent history, betting against the trend has been a losing proposition. Echoing previous updates (see here and here, for example), an ETF-based proxy for monitoring the directional bias of multi‑asset‑class strategies continues to skew positive, based on the ratio of two funds: an aggressive asset allocation strategy (AOA) vs. its conservative counterpart (AOK).

Looking below the surface, however, reveals substantial changes in leadership as bullish momentum accelerates in foreign stocks relative to US shares. The previous relative strength in American equities (VTI) has fully reversed against stocks in developed markets ex‑US (VEA).

A similarly sharp U‑turn is in progress for US equities (VTI) vs. stocks in emerging markets (VWO).

Another notable change: Within the US stock market, sentiment has recently shifted in favor of large‑cap value (IWD) over large‑cap growth (IWF). Although this turn is significant in that it breaks the long‑running dominance of large‑cap growth, it’s not yet clear if this is yet another short‑term change or the start of a secular trend.

As the chart above shows, there have been several periods since 2010 of short-lived relative strength for large‑cap value that quickly faded. The current pivot into value looks solid so far, but it’s still an open question if this trend signals a durable change in market sentiment.

If the value leadership persists, some analysts say it could have implications for the broader stock‑market outlook.

Stifel’s chief equity strategist, Barry Bannister, warns in a research note this week that some investors view the recent value rebound and growth‑stock weakness “as a sign of cyclical economic recovery, and it may be. But if this fade for growth relative to value accelerates and deepens, the history of ‘secular’ value‑led markets is one of a sharply declining price‑to‑earnings ratio over time, weaker S&P 500 returns and ever greater shocks, often lasting for many years.”

Learn To Use R For Portfolio Analysis
Quantitative Investment Portfolio Analytics In R:
An Introduction To R For Modeling Portfolio Risk and Return

By James Picerno

Bond Investors Embrace Maturity Risk In 2026

The risk appetite in the bond market has picked up this year as investors grow more comfortable with the economic outlook and the path of interest rates. A set of bond ETFs through yesterday’s close (Feb. 24) highlights a clear trend so far in 2026: favoring government securities with longer maturities has been a winning strategy.

Long‑dated Treasuries continue to lead by a comfortable margin year to date. The Vanguard Long‑Term Corporate Bond ETF (VCLT) is up 3.5% so far this year. In second place is the iShares 10–20 Year Treasury Bond ETF (TLH), posting a 2.8% year‑to‑date gain. On both counts, returns are far ahead of the U.S. investment‑grade fixed‑income benchmark, represented by the Vanguard Total Bond Market ETF (BND), which is up 1.5%.

The lone loser: bank loans (BKLN), which have slumped 2.0% this year. The ETF is getting hit amid heightened concerns about credit risk in leveraged loans. The pain is especially acute in the software industry, which is considered vulnerable amid rise of artificial intelligence. With nearly one‑fifth of BKLN’s portfolio exposed to software, the fund has taken a beating as the credit health of the industry has come under scrutiny.

Investors are asking: Does AI pose an existential crisis for software companies?

“The question is if [AI] agents and new platforms are interacting with existing software or replacing them,” says Jim Tierney, head of US growth investment at AllianceBernstein. “I’m leaning more to the former. What becomes the system of record for a business? It is unlikely to be a half dozen new vendors.”

As the crowd sorts out the answer, buying longer-dated Treasuries is in vogue. A key part of the reasoning is that inflation looks less threatening while the market is anticipating that the Federal Reserve will keep rates steady before resuming cuts in June, based on Fed funds futures. Add in the slowdown in economic growth and a downshift in hiring and conditions have been supportive for taking more risk in government bonds.

If one or more of those pillars shifts, the surge in the risk appetite for Treasuries could stumble. Fiscal risk is another potential source of anxiety for government bonds vis-à-vis a worrisome outlook for an already hefty federal budget deficit.

For the moment, however, the party continues as the bond market goes all-in on long Treasuries.


US Growth Slows in Q4, but Early Q1 Data Signals a Rebound

US economic growth posted a sizable downside miss in Friday’s fourth-quarter GDP report, but early Q1 nowcasts point to a rebound.

One theory for why output fell short of expectations in Q4 centers on the government shutdown in October. According to the Bureau of Economic Analysis, government spending subtracted nearly a full percentage point from headline GDP’s 1.4% annualized increase, marking a sharp downshift from Q3’s robust 4.4% increase.

A back-of-the-envelope estimate suggests that removing the 0.9 percentage point reduction in government spending (the deepest quarterly slide in six years) would have raised growth to the low 2%-plus range, just below the consensus forecast of 2.5%.

“The federal government shutdown clearly sent the economy careening off its strong growth path in the fourth quarter which is a one-off that won’t be repeated in early 2026,” said Chris Rupkey, chief economist at Fwdbonds.

Several nowcasts for Q1 agree, including the Atlanta Fed’s GDPNow model, estimating a 3.1% increase for GDP in the first three months of 2026 (as of Feb. 20). The New York Fed’s Q1 nowcast also reflects a recovery, albeit a softer one at an estimated rise of roughly 2.4% (Feb. 20).

Economic activity tracked by the Dallas Fed’s Weekly Economic Index indicates that the growth trend in recent history remains intact midway through Q1. The WEI rose to 2.58 through Feb. 14, the highest since August – a reading that’s above the pace of year-over-year GDP growth in 2025.

The key takeaway: The slowdown in Q4 growth doesn’t appear to be a warning flag for the economy. Although economic activity has probably slowed relative to the strong GDP increases in last year’s second half, the latest numbers point to moderate growth in the near term.

As usual these days, there could be several jokers in the deck that shock the otherwise upbeat outlook. Among the risk factors lurking at the moment: macro uncertainty following Friday’s ruling by the Supreme Court that President Trump’s tariffs are illegal and the threat of a US strike on Iran. Absent serious, sustained blowback from those events, however, the outlook still points to moderate growth for the near term.


A Triad of Risk Factors Stalks Markets This Week

The resilience of global markets will be tested anew this week as investors grapple with the implications of three risks that could roil sentiment: slower economic growth, the Supreme Court’s ruling that President Trump’s tariffs are illegal, and the threat of a US strike on Iran.

Let’s start with the US economy, which posted sharply slower growth in Friday’s fourth‑quarter GDP report. Output rose 1.4% — roughly half the pace expected and far behind the much stronger increases of 4.4% and 3.8% in the third and second quarters, respectively. The government shutdown was a key factor that weighed on economic activity and was estimated to have reduced growth by a percentage point.

The economy probably cooled even without the shutdown, but the slowdown was exaggerated in the official Q4 numbers. “The core of the economy is resilient,” said Michael Pearce at Oxford Economics. “With tariff pressures fading and tax cuts beginning to fuel an increase in capital spending, the economy will gather momentum in 2026.”

The initial nowcast for Q1 GDP points to a robust rebound, according to the Atlanta Fed’s GDPNow model, which is projecting a 3.1% increase. Sentiment in betting markets this morning is on board with the outlook: a 60% probability is currently priced in for Q1 growth of 3.0% or higher, according to Polymarket.

The economy may be stronger than it appears in the Q4 data, but uncertainty for trade policy spiked on Friday after the Supreme Court ruled that Trump’s import taxes were illegal. The President quickly countered that he would use another provision to impose a 15% tariff on all foreign goods coming into the country. But the whirlwind of trade‑policy news since Friday raises several questions that will take time to answer. Among the new issues raised:

* Trump’s new tariffs draw on authority from Section 122 of the Trade Act of 1974, but the provision limits how long tariffs can be imposed by the President — 150 days. Congress can extend the limit, but the unpopularity of tariffs in an election year looks like a hard sell for politicians seeking re‑election.

* Meanwhile, Trump said the administration will launch several investigations to address what it views as unfair trade practices by other countries and companies, drawing on the authority of Section 301 of the Trade Act of 1974.

Exactly how all this unfolds, and what it means for tariffs and trade, will remain a work in progress. One implication: the patchwork of trade deals the White House has negotiated with various countries now looks null and void as a sweeping, if temporary, 15% levy takes effect.

Meanwhile, the Supreme Court ruling on Friday implies that companies that paid tariffs over the past year are due refunds — $175 billion, by some estimates — a bill that would further deepen the federal government’s already steep budget deficit.

The more immediate threat for risk sentiment is the potential for a US attack on Iran. Trump is pressuring Iran over its nuclear program and has moved an array of military assets into striking range to intimidate Tehran. Talks between American and Iranian negotiators continue, but it’s not clear that Iran will capitulate — at least not to a degree that satisfies Trump.

In an interview on Sunday, Steve Witkoff, the President’s special envoy, said:

“I don’t want to use the word ‘frustrated’… because he [Trump] understands he’s got plenty of alternatives, but he’s curious as to why they haven’t… I don’t want to use the word ‘capitulated’, but why they haven’t capitulated. Why, under this sort of pressure, with the amount of sea power and naval power that we have over there, why haven’t they come to us and said, ‘We profess that we don’t want a weapon, so here’s what we’re prepared to do?'”

Some analysts fear that a US attack could trigger a wider regional conflict as Iran lashes out at its neighbors that host American military bases.

“For Iran, submitting to U.S. terms is more dangerous than suffering another US strike,” said Ali Vaez, the Iran director of the International Crisis Group. “They don’t believe that once they capitulate, the US will alleviate the pressure. They believe that would only encourage the US to go for the jugular.”

Markets now face a convergence of economic, legal, and geopolitical shocks that could easily destabilize sentiment if any one of them worsens. With growth slowing, trade policy in flux, and the risk of military escalation rising, the task of pricing in an uncertain future isn’t getting any easier.

Is Recession Risk Rising? Monitor the outlook with a subscription to:
The US Business Cycle Risk Report

Book Bits: 21 February 2026

Mastering Gold and Silver Markets: Insights from a Legendary Bullion Bank Trader
Robert Gottlieb
Summary via publisher (Wiley)
In Mastering Gold and Silver Markets: Insights from a Legendary Bullion Bank Trader, veteran precious metals trader, Robert Gottlieb, delivers an insightful blend of memoir and education that covers the world of bullion trading from a banker’s perspective. The book covers his journey from working at a certified public accounting firm to his position as the Global Head of Precious Metals Trading and Sales at many of the largest bullion banks in the world. Gottlieb dives deep into the critical role played by bullion banks in the global precious metals ecosystem. He provides a detailed explanation of financial and futures markets and how they facilitate liquidity and hedging strategies for their clients.

Made in America: The Hidden History of How the U.S. Enabled Communist China and Created Our Greatest Threat
Xi Van Fleet and Yu Jie
Summary via publisher (Hachette/Center Street)
From the acclaimed author of Mao’s America comes the untold story of how misguided and selfish U.S. elites transformed China from a Communist wasteland into a global superpower—at America’s expense. One of the most effective anti-communist voices in America today, Xi Van Fleet made waves with her breakout book Mao’s America, exposing eerie parallels between China’s past and America’s present woke revolution. Now, alongside renowned Chinese dissident Yu Jie, she sounds the alarm once more—revealing how the CCP’s rise was not just enabled by Soviet Russia but, shockingly, by the United States itself.

The Intelligent Crypto Investor: A Simple Strategy for Building Wealth in a New Financial World
John Hargrave
Summary via publisher (Wiley)
Crypto just crossed the tipping point, and everything you thought you knew about investing is about to change. The world’s biggest institutions are pouring billions into bitcoin—while most mainstream investors are still sitting on the sidelines, frozen by fear. That’s where The Intelligent Crypto Investor comes in. Backed by seven years of real-world results, this groundbreaking book shows how adding just a small slice of crypto (10% or less) to a balanced portfolio can dramatically improve long-term returns—outperforming traditional portfolios by more than 65%. Through the stories of legendary investors like Warren Buffett, Jack Bogle, and Cathie Wood, bestselling author John Hargrave unveils a clear, accessible strategy for adding bitcoin and other high-quality crypto assets to your portfolio—with minimal risk and maximum intelligence.

Please note that the links to books above are affiliate links with Amazon.com and James Picerno (a.k.a. The Capital Spectator) earns money if you buy one of the titles listed. Also note that you will not pay extra for a book even though it generates revenue for The Capital Spectator. By purchasing books through this site, you provide support for The Capital Spectator’s free content. Thank you!

Research Review | 20 February 2026 | Forecasting Returns

CAPE Ratios and Long-Term Returns
Rui Ma (La Trobe University), et al.
January 2026
We demonstrate that 10-year equity market returns are considerably more predictable in relation to price-earnings ratios than previously thought. The traditional approach involves relating the current index price level, based on current index components, to the index earnings of previous years, calculated using those years’ components. When we estimate the cyclically adjusted price-earnings (CAPE) ratio, ensuring that index component prices and earnings are aligned, and apply a superior regression approach, out-of-sample R 2 values are over 50%. The Component CAPE ratio weights individual stock CAPE ratios by their market capitalization, whereas the traditional CAPE ratio is more closely aligned with earnings weighting.

Multiples for Valuation: Go High, Go Low, Ignore the Middle
Javier Estrada (IESE Business School)
February 2026
Multiples such as D/P, P/E and CAPE have long been viewed as being useful to forecast returns over periods of ten or so years. The evidence discussed in this article supports this belief and takes it one step further by showing that multiples are far more useful when they are relatively high or low than when they are somewhere in the middle of their historical range. In fact, relatively high or low multiples are more highly correlated to forward returns in sample, and produce better return forecasts out of sample, than multiples that lie somewhere in the middle.

Credit Spread News and Financial Market Risk
Fabrizio Ghezzi (University of California San Diego)
December 2025
This paper shows that credit spread news, defined by changes and absolute changes in corporate bond credit spreads, predict a substantial share of future variation in financial market risk. I first document a strong and robust predictive relationship between credit spread news and financial market risk. I then investigate the economic mechanism underlying this relationship and provide both theoretical and empirical evidence highlighting a central role for financial intermediaries’ risk expectations. Together, these findings establish credit spread news as statistically significant and economically meaningful predictors of financial market risk.

Mean-Reversions in the Debt-to-GDP Ratio and Predictability of Treasury Debt Returns and Surpluses
Deshui Yu (Hunan University), et al.
November 2025
The debt-to-GDP (DG) ratio should predict Treasury returns and primary surpluses according to the present-value identity, yet empirical support remains elusive. This paper resolves this puzzle by decomposing the DG ratio into a slow mean-reversion component and a local mean-reversion component. We show that the local mean-reversion of the DG ratio delivers substantially improved out-of-sample forecast gains of Treasury debt returns and surpluses, outperforming the original DG ratio, the historical average benchmark, and the adjusted ratios subject to structural breaks. In contrast, the slow mean-reversion component obscures predictive information by incorporating persistent, non-fundamental variation. Our findings are robust to alternative decomposition methods and DG ratio definitions (including nonmarketable debt). We develop a revised fiscal present-value model to rationalize the findings.

Extracting Forward Equity Return Expectations Using Derivatives
Steven P. Clark (University of North Carolina at Charlotte), et al.
January 2025
This paper develops a framework for extracting conditional expectations of future equity returns from derivative prices. We show that expected returns can be identified not only at the spot horizon, but also for forward-starting investment periods, yielding the full surface of expected future returns. Using index options, we derive theoretical bounds on future returns, and using VIX derivatives, we link risk-neutral and real-world expectations. Empirically, derivative-implied expectations exhibit sharp shifts around major crises, reveal persistent negative dependence between adjacent monthly returns, and generate economically valuable reversal signals. These findings uncover new dimensions of return predictability embedded in derivatives markets.

Learn To Use R For Portfolio Analysis
Quantitative Investment Portfolio Analytics In R:
An Introduction To R For Modeling Portfolio Risk and Return

By James Picerno

US Q4 Growth Set To Extend Streak As K-Shaped Risk Lurks

The US economy is on track to report a third straight quarter of growth in tomorrow’s delayed GDP update for Q4, based on the median of a set of nowcasts compiled by The Capital Spectator. The pace is expected to slow from Q3, but the increase will be strong enough to keep last year’s chatter about recession on the fringes of economic analysis.

Today’s revised estimate shows output in the previous quarter rose 2.7% at an annualized rate for GDP, unchanged from the previous estimate. If this median nowcast is accurate, growth will downshift from Q3’s strong 4.4% advance, which marked a two-year high.

An encouraging sign is the relatively steady run of median nowcasts lately, following several upward revisions. Nearly a month ago, the median estimate was 2.1%, which was revised up earlier this month and is holding at 2.7% ahead of tomorrow’s release from the Bureau of Economic Analysis.

The widely followed GDPNow estimate from the Atlanta Fed remains the upside outlier, currently nowcasting a 3.6% increase. Using this outlook as a guide in context with our median nowcast implies that a high-2%-to-low-3% increase is a reasonable assumption for tomorrow’s release.

Although the top-line measure of economic activity is expected to chug along at a solid pace for a third straight quarter, there are growing concerns about the so-called K-economy effect – a reference to an uneven economy across sectors and households. For example, a substantial gap in consumer sentiment has opened up between consumers with equity investments compared with households with little or no stock holdings. “Sentiment surged [in February] for consumers with the largest stock portfolios, while it stagnated and remained at dismal levels for consumers without stock holdings,” survey director Joanne Hsu said.

The gap between high and low earners “leaves the economy much more sensitive,” said Samuel Tombs, chief US economist at Pantheon Macroeconomics. “It’s almost like the stock market is the tail that’s wagging the dog of the economy,” added Emily Roland, co-chief investment strategist at Manulife John Hancock Investments.

The implication: a sharp fall in the stock market could have outsized effects on the economy. That’s a risk for 2026, but the threat is expected to remain muted in tomorrow’s GDP update.

Is Recession Risk Rising? Monitor the outlook with a subscription to:
The US Business Cycle Risk Report

Pages